

Question: The graph below shows the Security Market Line (SML), based on a market return of 12%. Assets A and Bare both represented on the graph
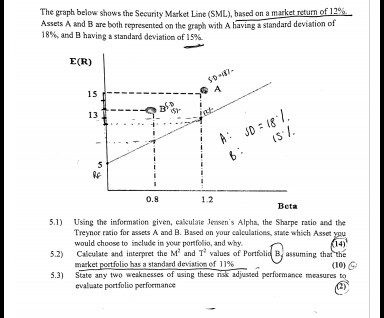
The graph below shows the Security Market Line (SML), based on a market return of 12%. Assets A and Bare both represented on the graph with A having a standard deviation of 18% and B having a standard deviation of 15%. Using the information given, calculate Jensen's Alpha, the Sharpe ratio and the Treyner ratio for assets A and B. Based on your calculations, state which Asset you would choose to include in your portfolio, and why. Calculate and interpret the M^2 and T^2 values of Portfolio B assuming that the market portfolio has a standard deviation of 11% State any two weaknesses of using these risk adjusted performance measures to evaluate portfolio performance
Step by Step Solution
There are 3 Steps involved in it

Get step-by-step solutions from verified subject matter experts