

Question: The graph below shows three constant reliability contours on a radial load vs . life plot for a ball bearing. Both the ( x
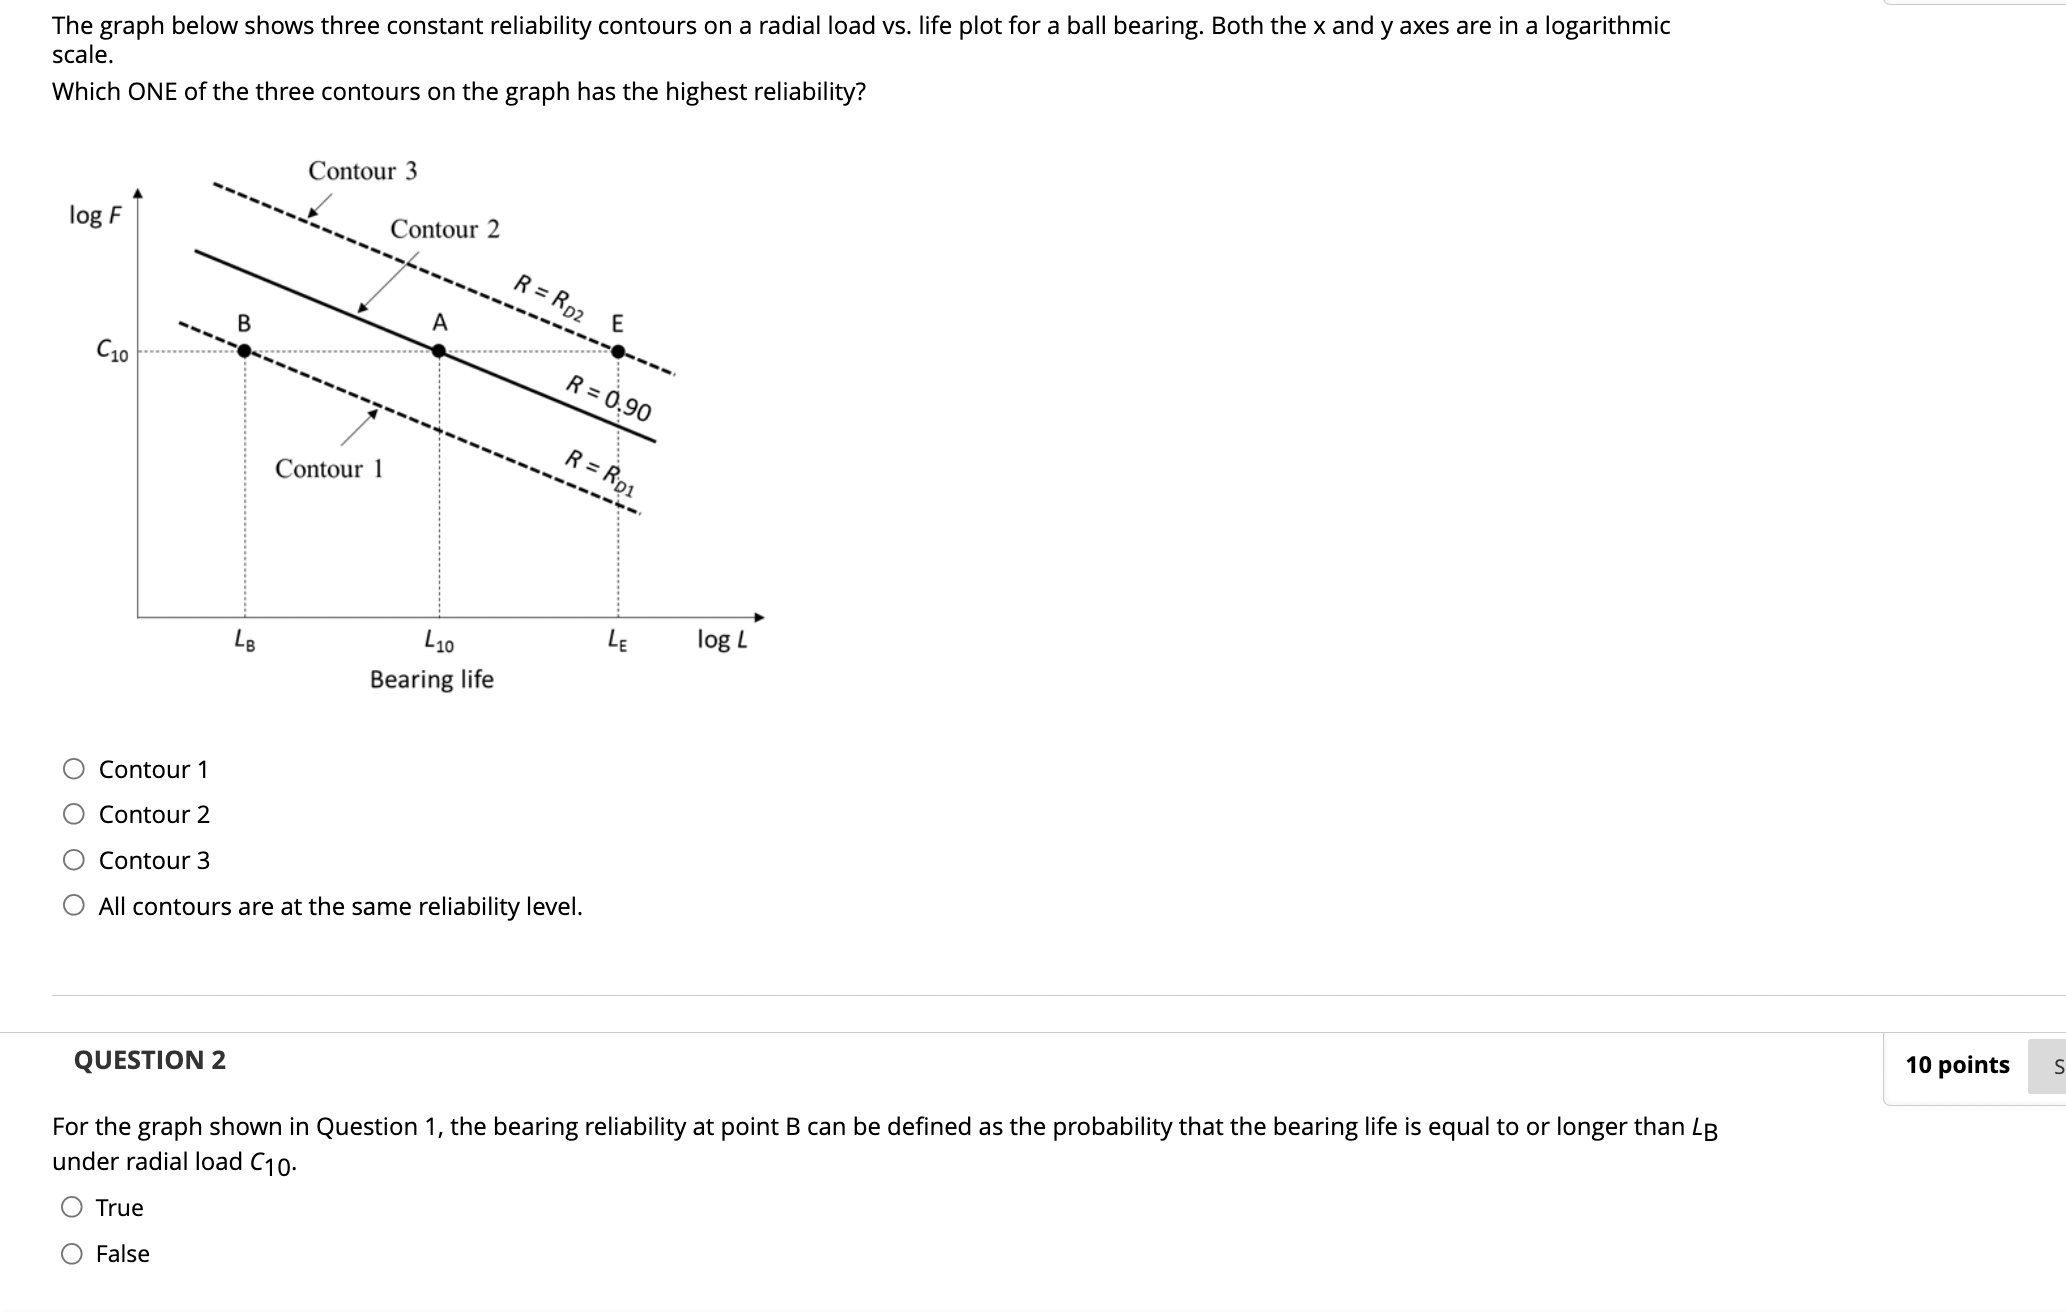
The graph below shows three constant reliability contours on a radial load vs life plot for a ball bearing. Both the x and y axes are in a logarithmic scale.
Which ONE of the three contours on the graph has the highest reliability?
Contour
Contour
Contour
All contours are at the same reliability level.
QUESTION
For the graph shown in Question the bearing reliability at point B can be defined as the probability that the bearing life is equal to or longer than LB under radial load C
True
False
Step by Step Solution
There are 3 Steps involved in it
1 Expert Approved Answer
Step: 1 Unlock

Question Has Been Solved by an Expert!
Get step-by-step solutions from verified subject matter experts
Step: 2 Unlock
Step: 3 Unlock