

The graph below shows three plots of velocity (v0) versus substrate concentration ([S]). Determine which curve represents
Fantastic news! We've Found the answer you've been seeking!
Question:
The graph below shows three plots of velocity (v0) versus substrate concentration ([S]). Determine which curve represents an enzyme's reaction velocity without any inhibitor present, which curve represents the velocity in the presence of a mixed inhibitor, and which curve represents the velocity in the presence of a competitive inhibitor.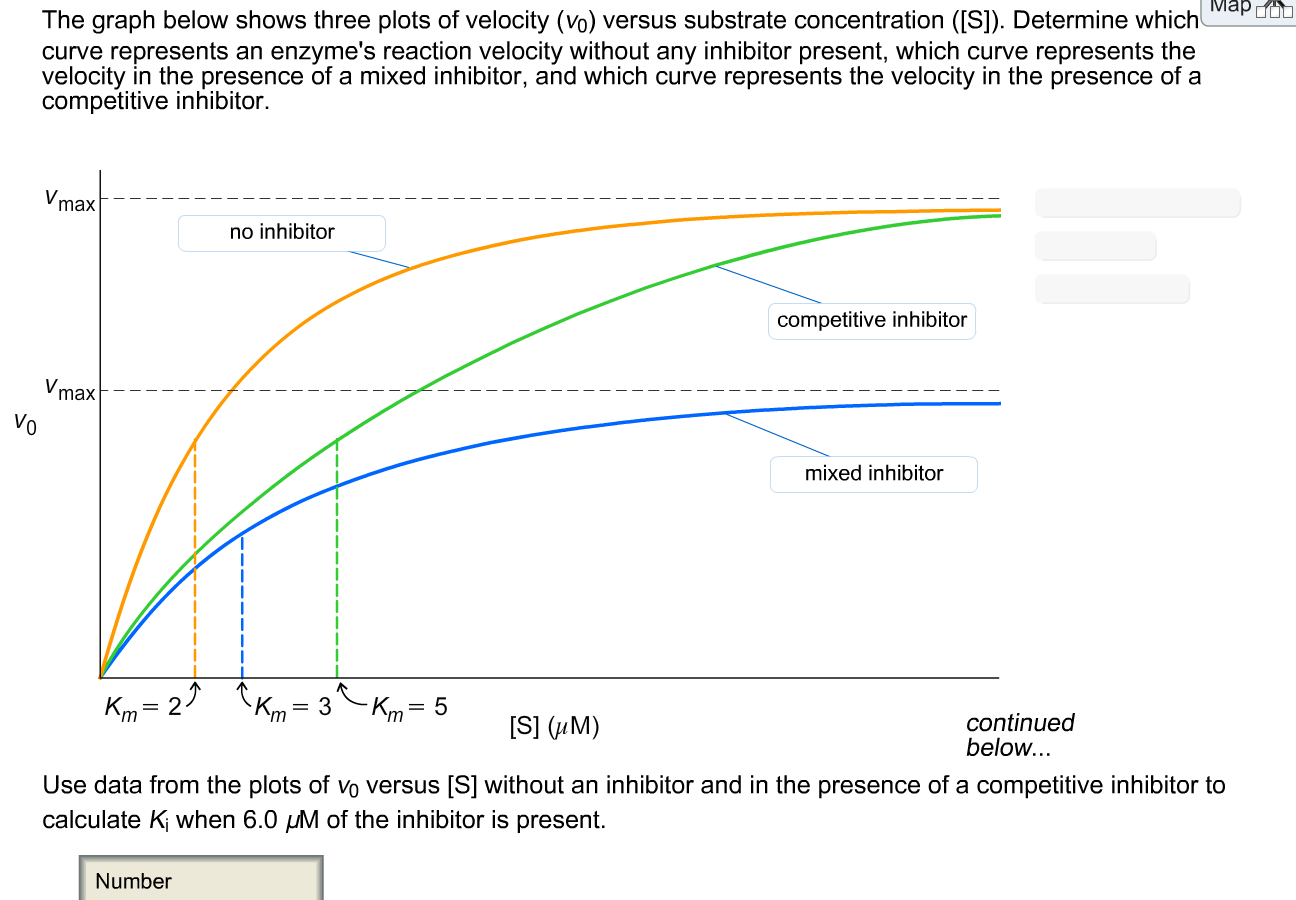
Expert Answer:

Related Book For 

Horngrens Cost Accounting A Managerial Emphasis
ISBN: 9780135628478
17th Edition
Authors: Srikant M. Datar, Madhav V. Rajan
Posted Date:
