

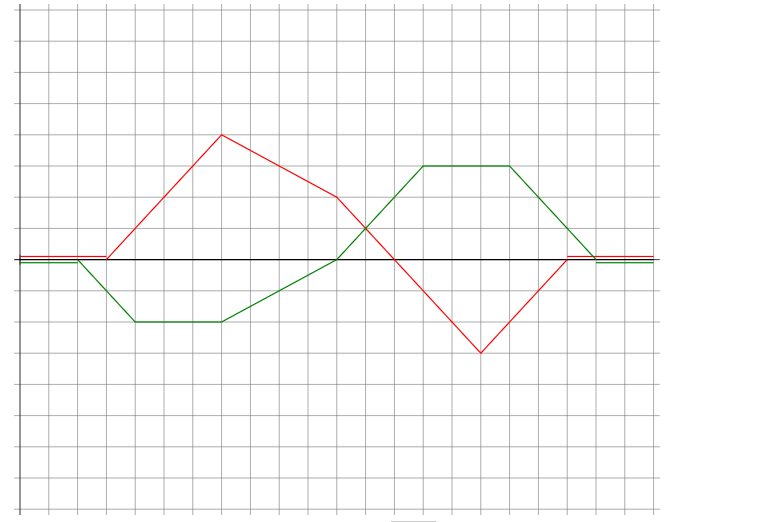
Question: The graph below shows two pulses that are moving along a string that lies along the horizontal center line of the grid. The red line
The graph below shows two pulses that are moving along a string that lies along the horizontal center line of the grid. The red line shows a pulse that is moving along the string to left when the green pulse is absent. Similarly, the green line shows a pulse that is moving along the string to the right when the red pulse is missing. Plot the actual position of the string when both pulses are present.
Step by Step Solution
There are 3 Steps involved in it
1 Expert Approved Answer
Step: 1 Unlock

Question Has Been Solved by an Expert!
Get step-by-step solutions from verified subject matter experts
Step: 2 Unlock
Step: 3 Unlock