

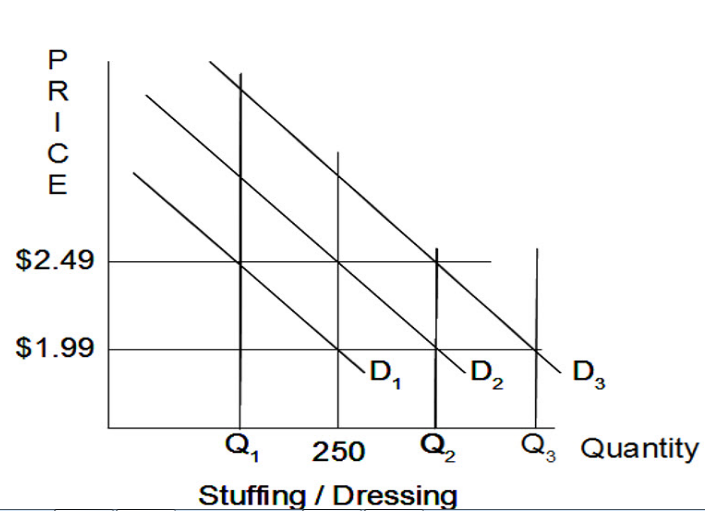
Question: The graph describes the demand for Sage and Herb Stuffing. At a price of $2.49 the grocery store sells 250 bags of stuffing per week.
The graph describes the demand for Sage and Herb Stuffing. At a price of $2.49 the grocery store sells 250 bags of stuffing per week. Using sales data, the store estimates the price elasticity of demand to be 1.2 using the midpoint formula.
It was also a bigger than expected harvest for red bliss potatoes and the price of red bliss potatoes fell from 1.79 to 1.49 and the quantity of stuffing sold dropped to 210. What is the cross elasticity of demand for red bliss potatoes and stuffing?
Step by Step Solution
There are 3 Steps involved in it
1 Expert Approved Answer
Step: 1 Unlock

Question Has Been Solved by an Expert!
Get step-by-step solutions from verified subject matter experts
Step: 2 Unlock
Step: 3 Unlock