

Question: The graph illustrates a normal distribution for the prices for a particular model of HD television. The mean price paid is $1800 and the standard
The graph illustrates a normal distribution for the prices for a particular model of HD television. The mean price paid is $1800 and the standard deviation is $105. Use Empirical Rule for full credit.
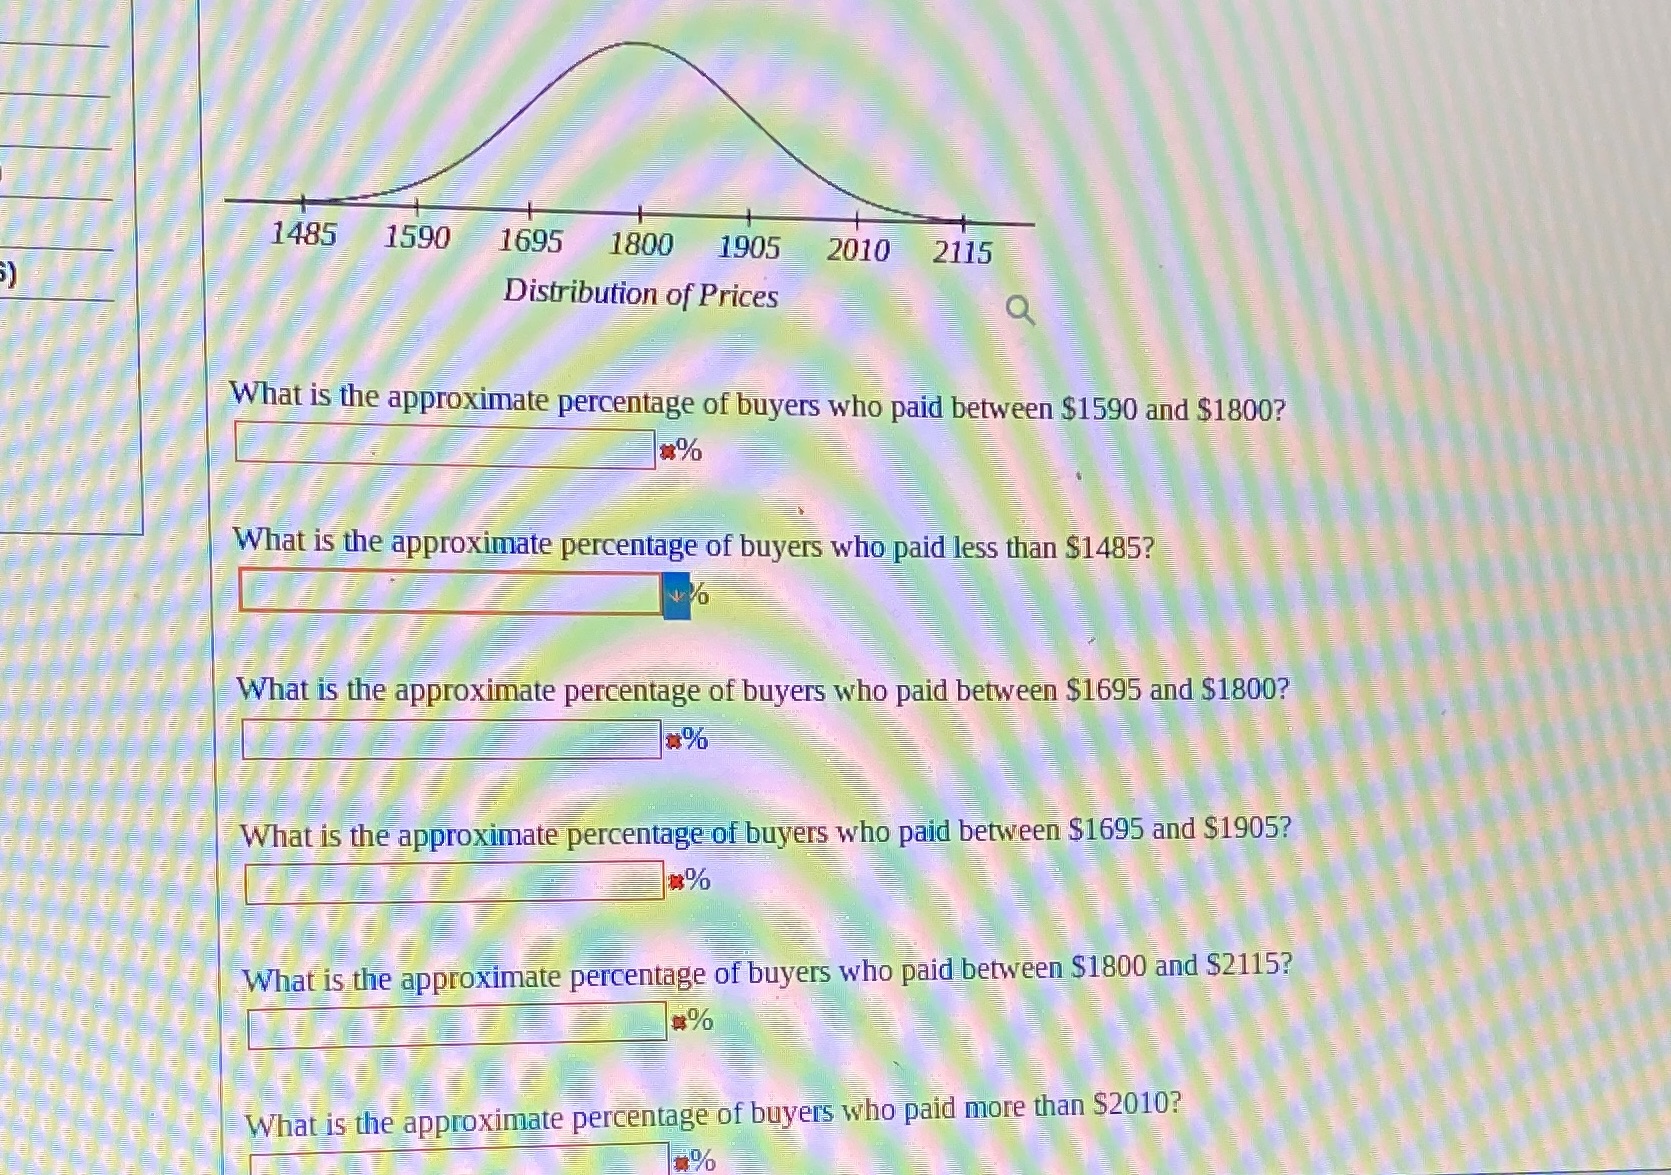
1485 1590 1695 1800 1905 2010 2115 Distribution of Prices Q What is the approximate percentage of buyers who paid between $1590 and $1800? What is the approximate percentage of buyers who paid less than $1485? What is the approximate percentage of buyers who paid between $1695 and $1800? #% What is the approximate percentage of buyers who paid between $1695 and $1905? What is the approximate percentage of buyers who paid between $1800 and $2115? What is the approximate percentage of buyers who paid more than $2010
Step by Step Solution
There are 3 Steps involved in it

Get step-by-step solutions from verified subject matter experts