

Question: The graph illustrates a normal distribution for the prices paid for a particular model of HD television. The mean price paid is $1800 and the
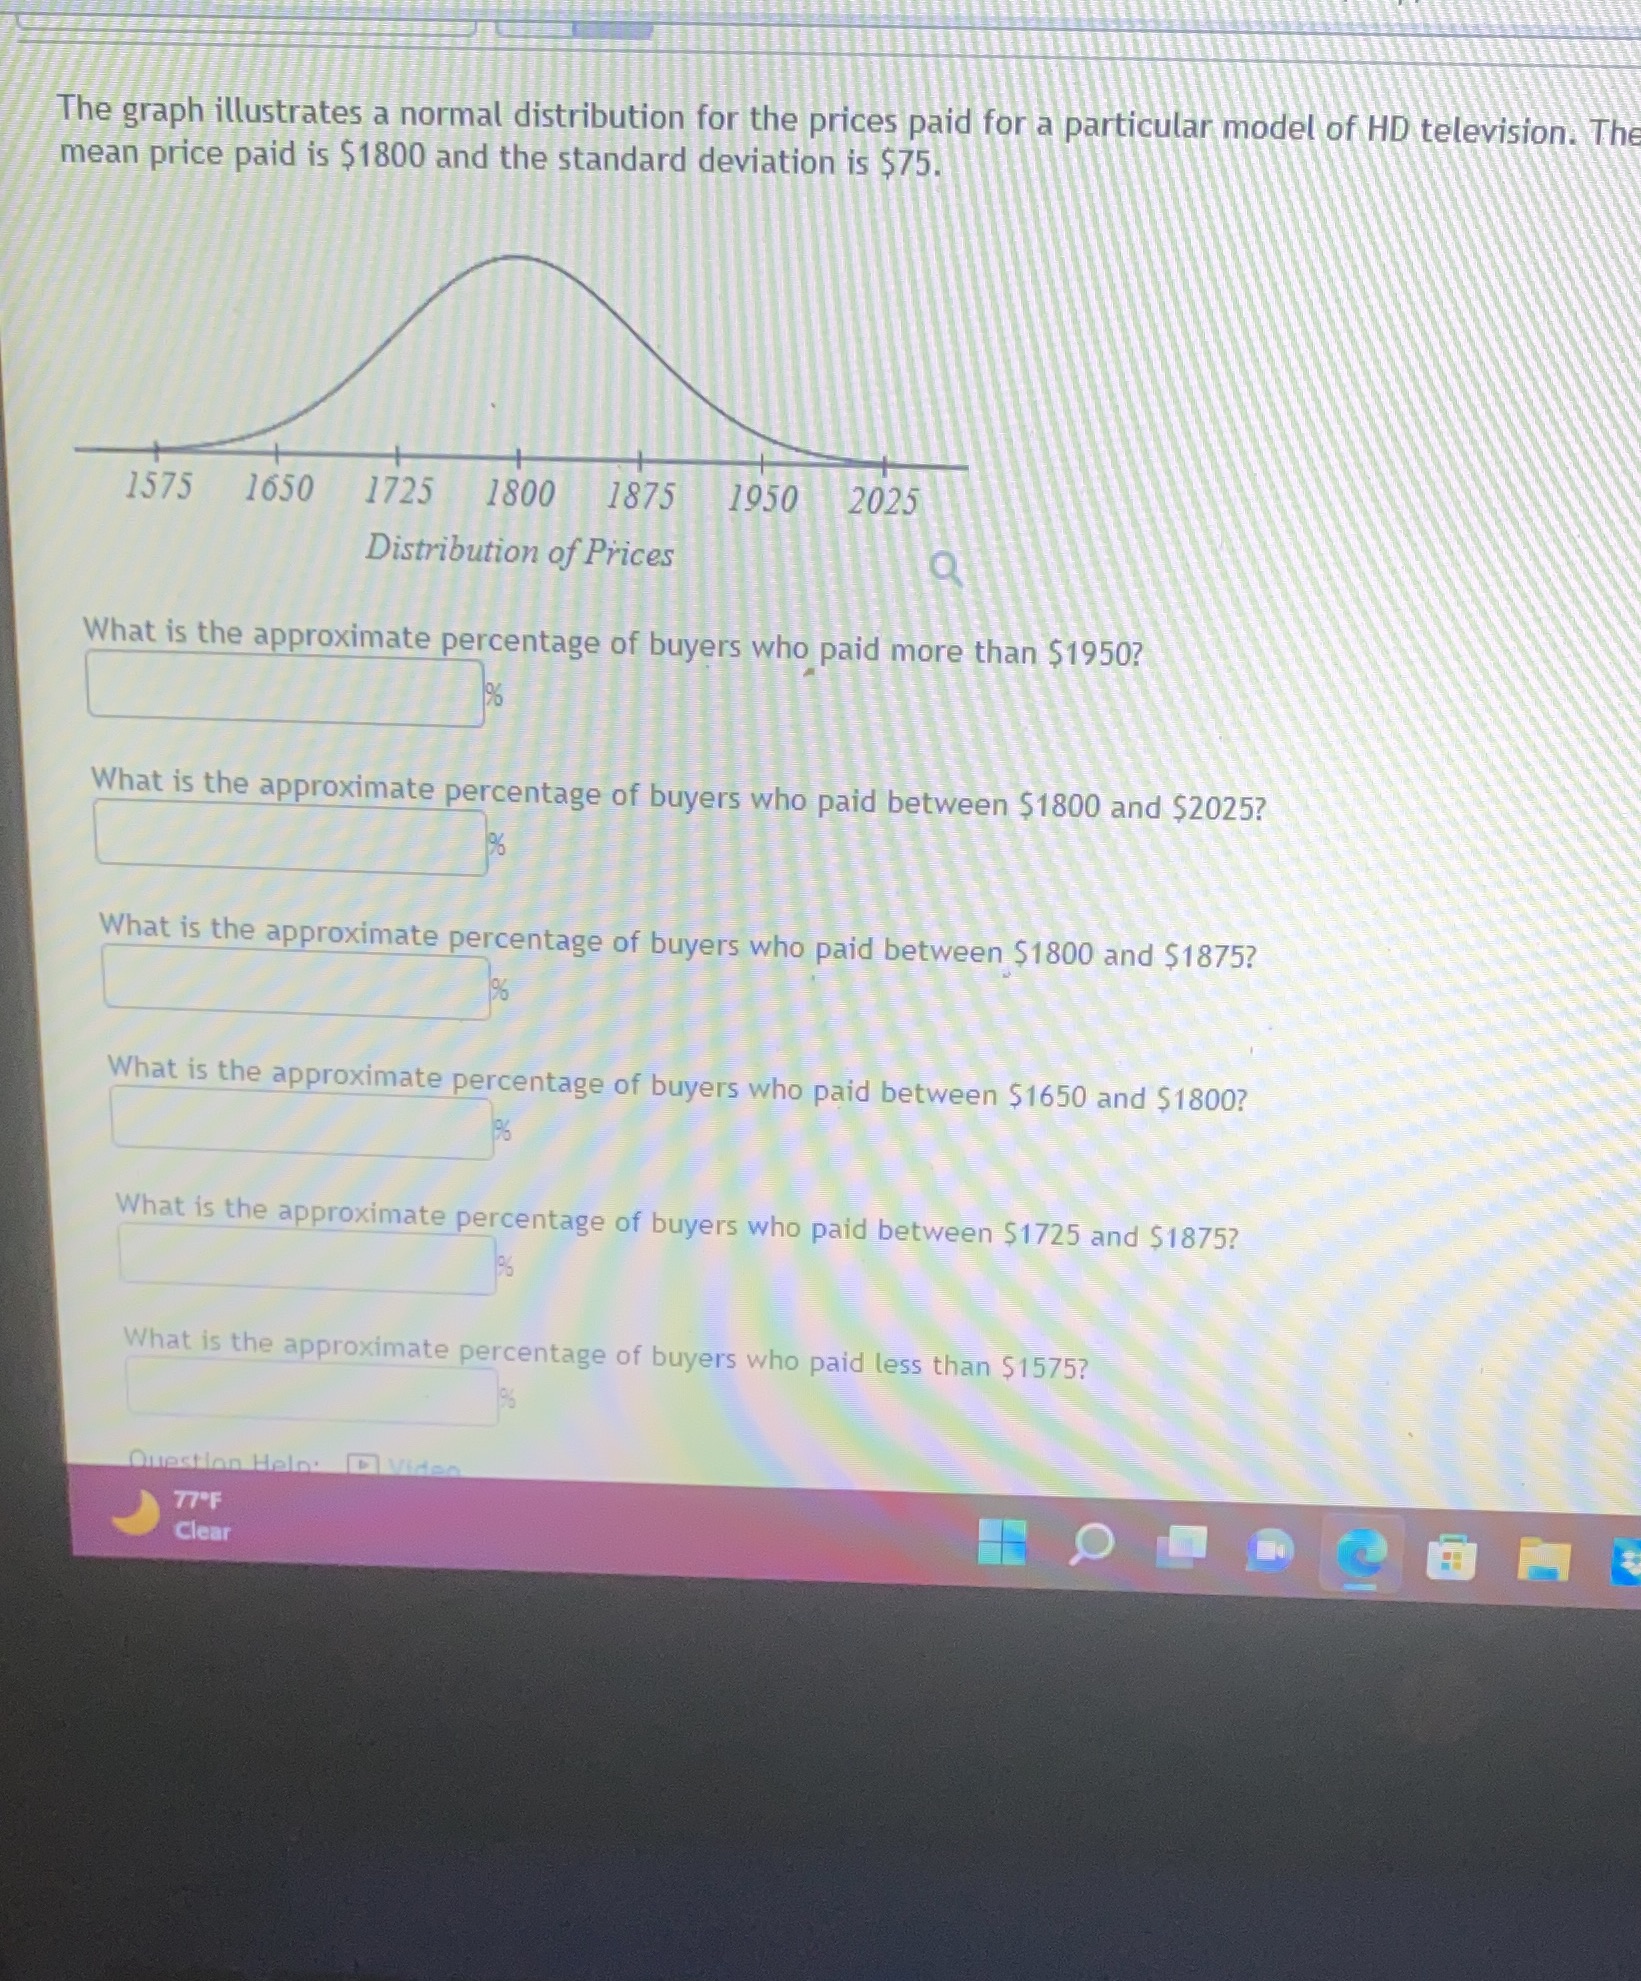
The graph illustrates a normal distribution for the prices paid for a particular model of HD television. The mean price paid is $1800 and the standard deviation is $75. 1575 1650 1725 1800 1875 1950 2025 Distribution of Prices Q What is the approximate percentage of buyers who paid more than $1950? What is the approximate percentage of buyers who paid between $1800 and $2025? What is the approximate percentage of buyers who paid between $1800 and $1875? What is the approximate percentage of buyers who paid between $1650 and $1800? What is the approximate percentage of buyers who paid between $1725 and $1875? What is the approximate percentage of buyers who paid less than $1575? Question Help. Divide 77'F Clear
Step by Step Solution
There are 3 Steps involved in it

Get step-by-step solutions from verified subject matter experts