

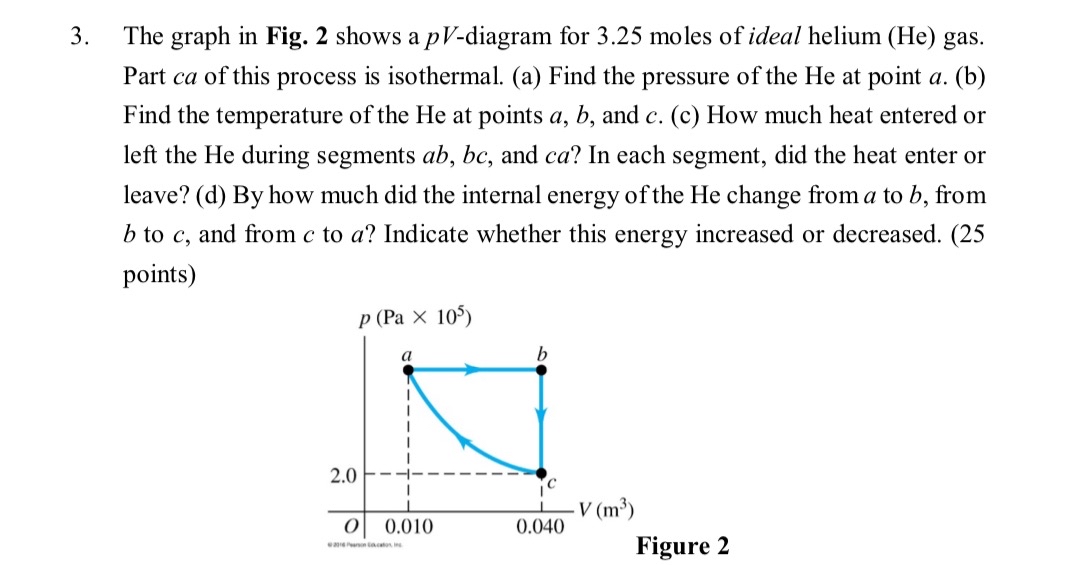
Question: The graph in Fig. 2 shows a p V - diagram for 3 . 2 5 moles of ideal helium ( He ) gas. Part
The graph in Fig. shows a diagram for moles of ideal helium He gas. Part of this process is isothermal. a Find the pressure of the He at point b Find the temperature of the He at points and c How much heat entered or left the He during segments and In each segment, did the heat enter or leave? d By how much did the internal energy of the He change from to from to and from to Indicate whether this energy increased or decreased. points
e
Step by Step Solution
There are 3 Steps involved in it
1 Expert Approved Answer
Step: 1 Unlock

Question Has Been Solved by an Expert!
Get step-by-step solutions from verified subject matter experts
Step: 2 Unlock
Step: 3 Unlock