

Question: The graph in the figure above depicts a temperature-composition solid-liquid phase diagram. 1. Name the phases in the regions 1-8 [8] 2. At what temperatures
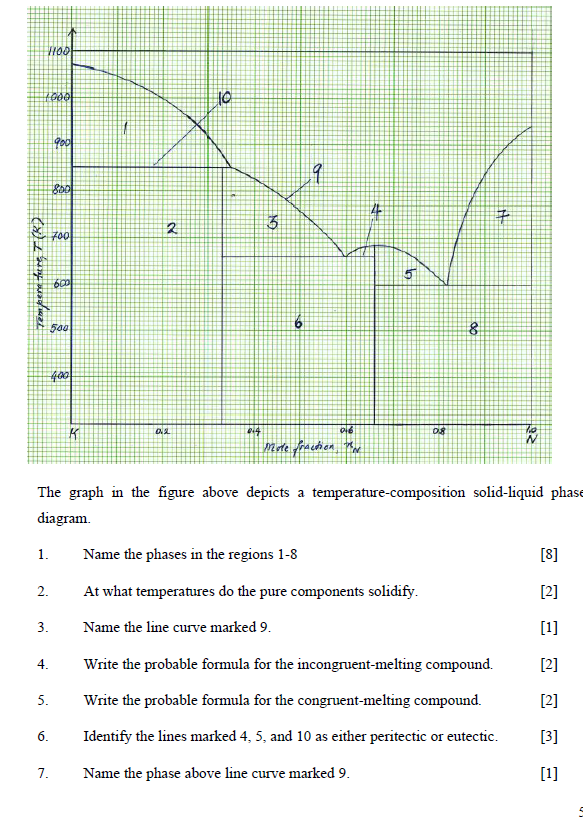
The graph in the figure above depicts a temperature-composition solid-liquid phase diagram. 1. Name the phases in the regions 1-8 [8] 2. At what temperatures do the pure components solidify. [2] 3. Name the line curve marked 9. [1] 4. Write the probable formula for the incongruent-melting compound. [2] 5. Write the probable formula for the congruent-melting compound. [2] 6. Identify the lines marked 4, 5, and 10 as either peritectic or eutectic. [3] 7. Name the phase above line curve marked 9.
WOO 1 del 10 9001 9 9 800 5 + 4 7 2 700 Temper fare (R2 6 600 500 8 400 014 ole 0.8 K ho Mide prachon, The graph in the figure above depicts a temperature-composition solid-liquid phase diagram 1. Name the phases in the regions 1-8 [8] 2. [2] 3. [1] 4. At what temperatures do the pure components solidify. Name the line curve marked 9. Write the probable formula for the incongruent-melting compound. Write the probable formula for the congruent-melting compound. Identify the lines marked 4, 5, and 10 as either peritectic or eutectic. [2] 5. [2] 6. [3] 7. Name the phase above line curve marked 9. [1]
Step by Step Solution
There are 3 Steps involved in it

Get step-by-step solutions from verified subject matter experts