

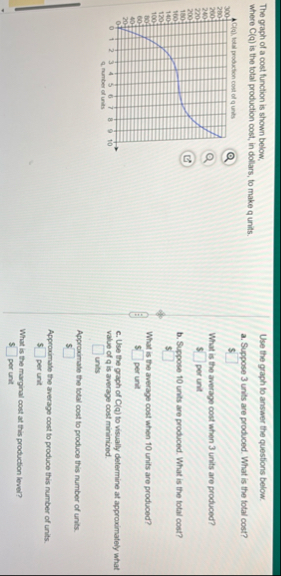
Question: The graph of a cost function is shown below, where C ( q ) is the total production cost, in dollars, to make q units.
The graph of a cost function is shown below, where is the total production cost, in dollars, to make q units.
Use the graph to answer the questions below.
a Suppose units are produced. What is the fotal cost?
What is the average cost when units are produced?
per unit
b Suppose units are produced. What is the total cost?
What is the average cost when units are produced?
per unit
c Use the graph of C q to visually determine at approximately what value of is average cost minimized.
units
Approximate the fotal cost to produce this number of units.
Approximate the average cost to produce this number of units.
per unit
What is the marginal cost at this production level?
per unit
Step by Step Solution
There are 3 Steps involved in it
1 Expert Approved Answer
Step: 1 Unlock

Question Has Been Solved by an Expert!
Get step-by-step solutions from verified subject matter experts
Step: 2 Unlock
Step: 3 Unlock