

Question: The graph of a function f is shown below. Use the graph of the function to find its average rate of change from x =
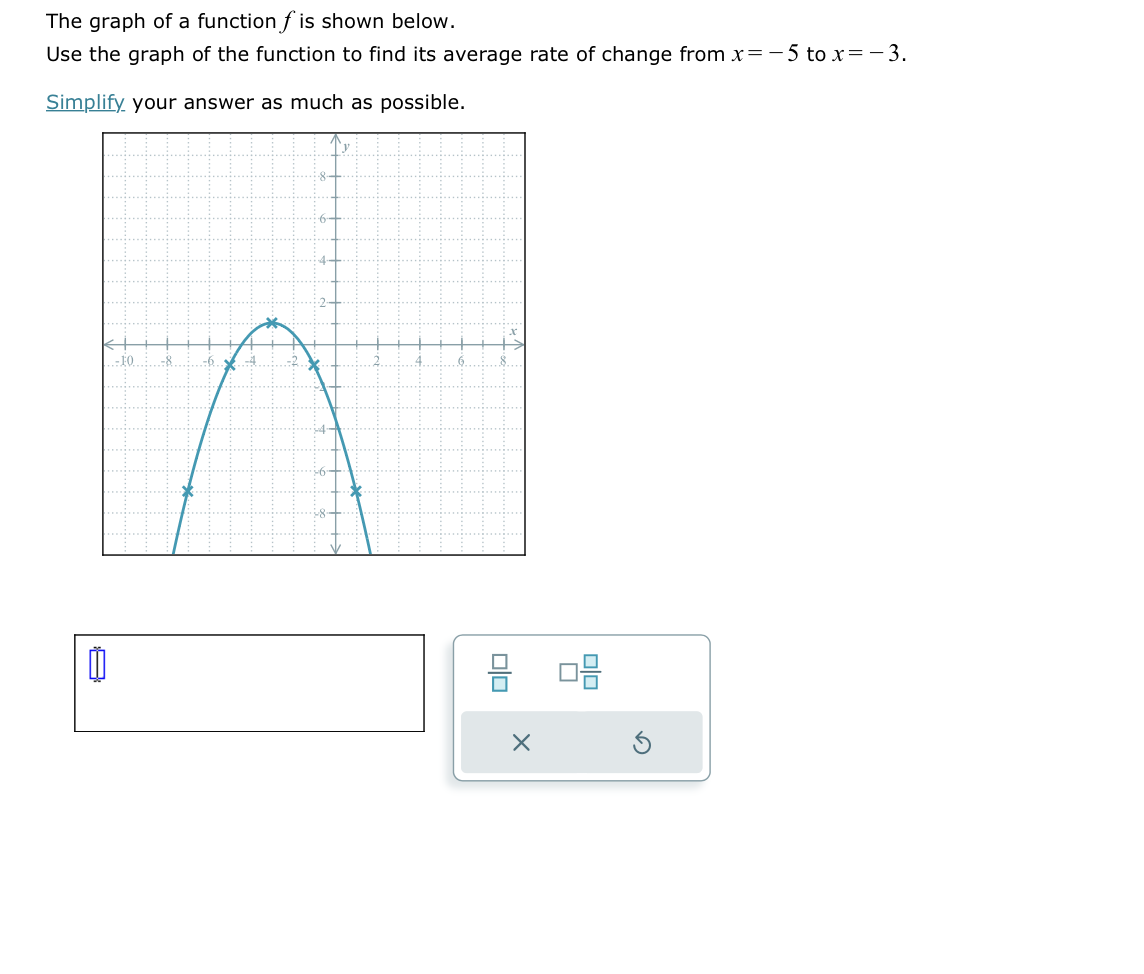
The graph of a function f is shown below. Use the graph of the function to find its average rate of change from x = -5 to x = - 3. Simplify your answer as much as possible. ........... ............. ..... ................... ... ...................... ... .. . ............. ... ........ ... ..: 10... .4. ..6.. .. .8... ....... ....... ........ ..... ........ ...i.... ........ ....... ... .... .... ...... ..... X 5
Step by Step Solution
There are 3 Steps involved in it
1 Expert Approved Answer
Step: 1 Unlock

Question Has Been Solved by an Expert!
Get step-by-step solutions from verified subject matter experts
Step: 2 Unlock
Step: 3 Unlock