

Question: The graph of a function g is shown. YA 0 1 X subinterval Estimate g(x) dx with six sebintervals using the following. (a) right
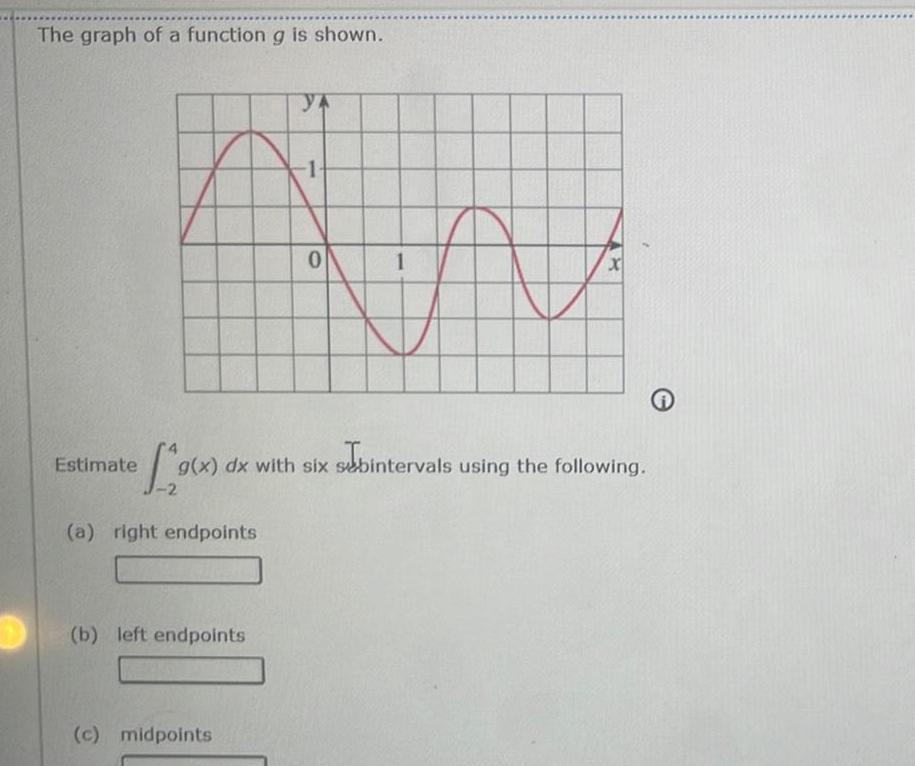
The graph of a function g is shown. YA 0 1 X subinterval Estimate g(x) dx with six sebintervals using the following. (a) right endpoints (b) left endpoints (c) midpoints
Step by Step Solution
There are 3 Steps involved in it
1 Expert Approved Answer
Step: 1 Unlock

Question Has Been Solved by an Expert!
Get step-by-step solutions from verified subject matter experts
Step: 2 Unlock
Step: 3 Unlock