

Question: The graph of a function is given. y (a) Determine the net change between the indicated points on the graph. (b) Determine the average rate
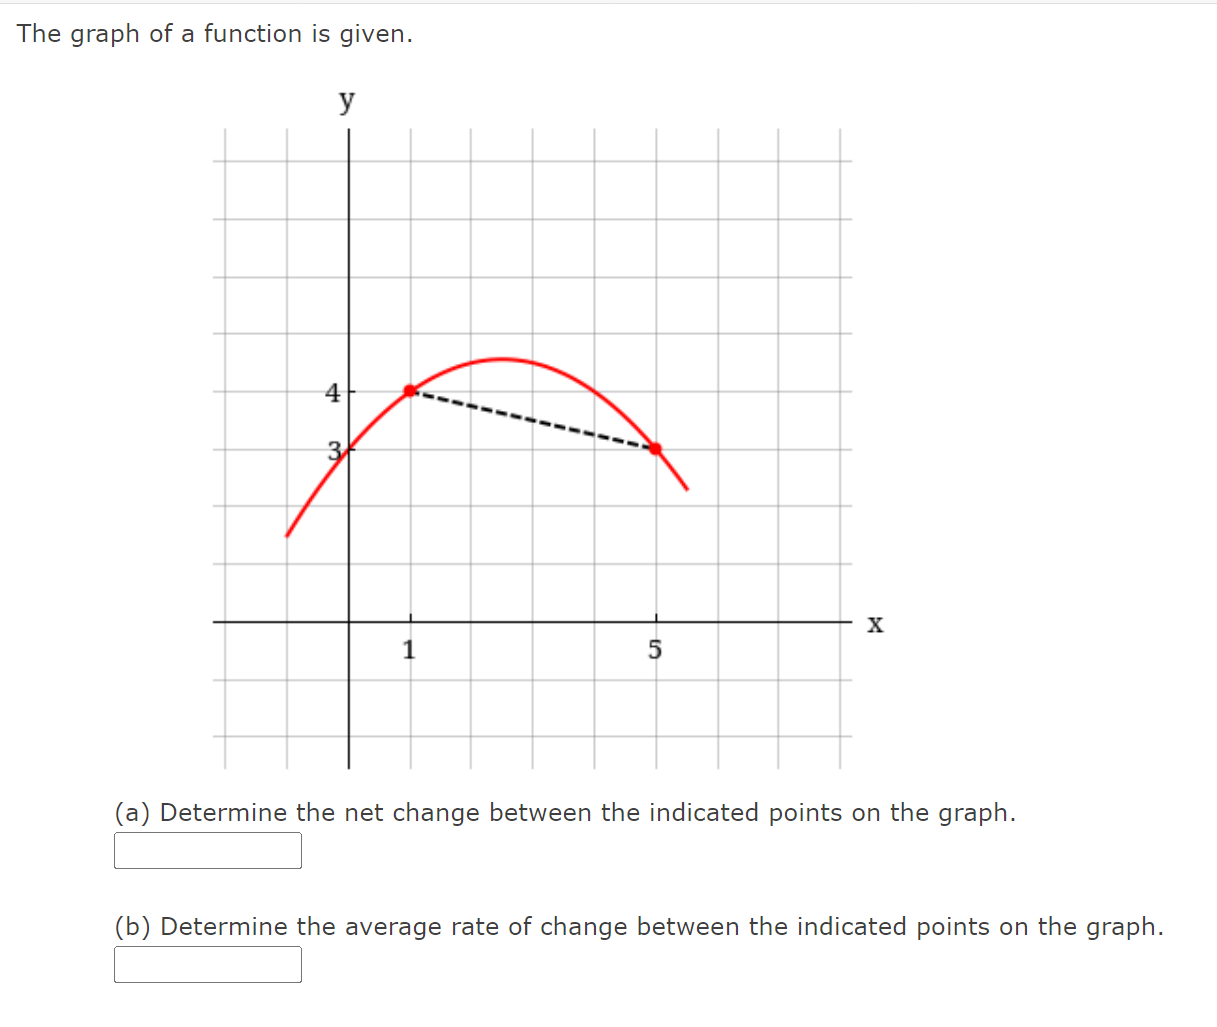
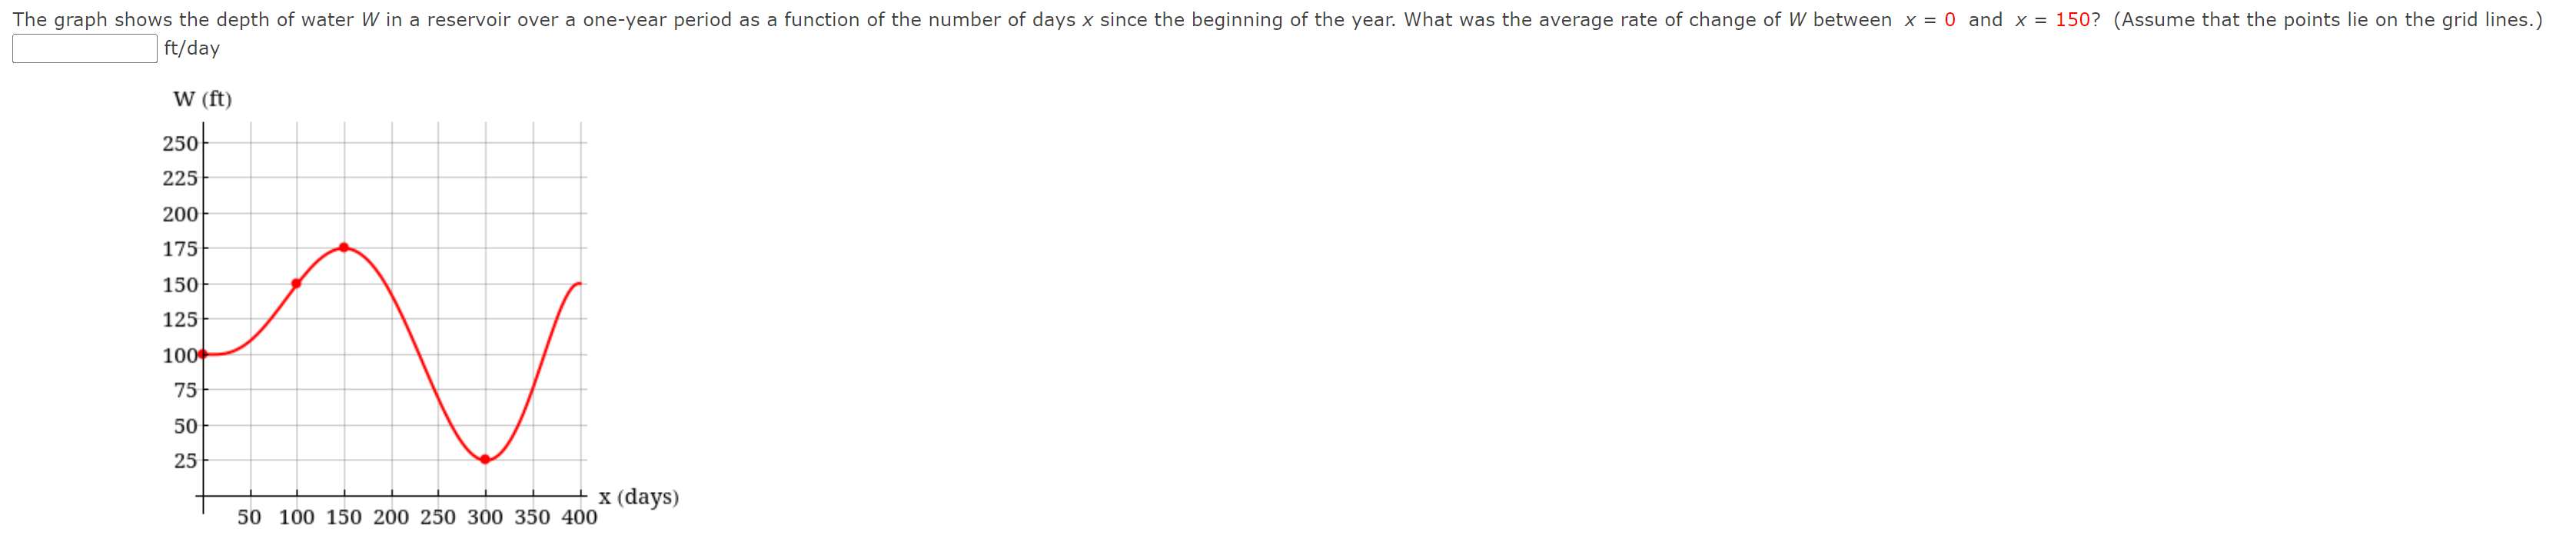
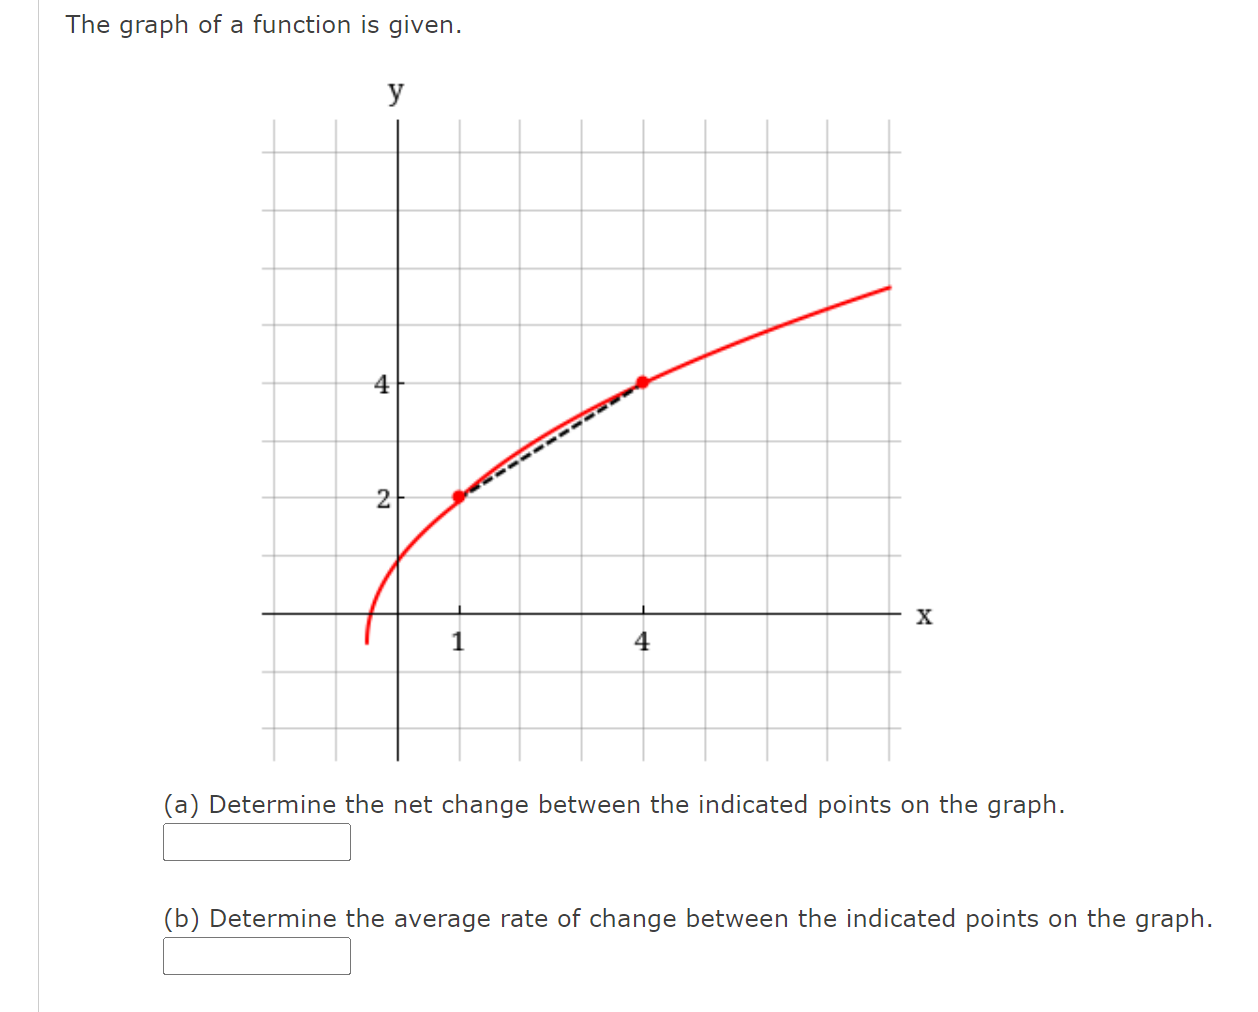
The graph of a function is given. y (a) Determine the net change between the indicated points on the graph. (b) Determine the average rate of change between the indicated points on the graph. The graph shows the depth of water W in a reservoir over a one-year period as a function of the number of days x since the beginning of the year. What was the average rate of change of W between x = 0 and x = 1507 (Assume that the points lie on the grid lines.) ft/day W (ft) 250 225 200 175 150 125 10t 75 50 25 X (days) 50 100 150 200 250 300 350 400 The graph of a function is given. y (a) Determine the net change between the indicated points on the graph. (b) Determine the average rate of change between the indicated points on the graph
Step by Step Solution
There are 3 Steps involved in it

Get step-by-step solutions from verified subject matter experts