

Question: The graph of a function is shown on the grid. 0 1 2 3 4 5 6 7 89 -x What appears to be the
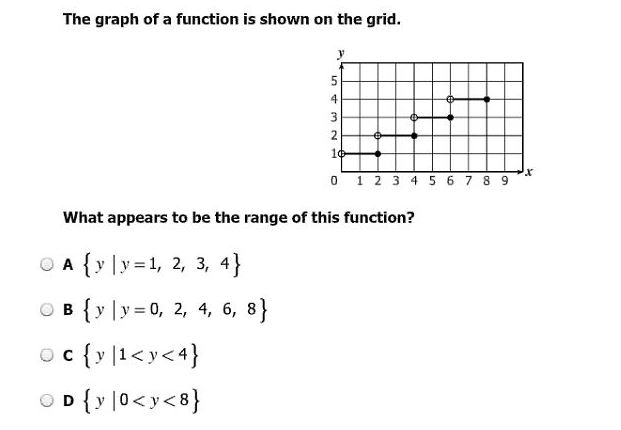

The graph of a function is shown on the grid. 0 1 2 3 4 5 6 7 89 -x What appears to be the range of this function? OA y y =1, 2, 3, 4 OB {y y = 0, 2, 4, 6, 8 octyl
Step by Step Solution
There are 3 Steps involved in it
1 Expert Approved Answer
Step: 1 Unlock

Question Has Been Solved by an Expert!
Get step-by-step solutions from verified subject matter experts
Step: 2 Unlock
Step: 3 Unlock