

Question: The graph on the left below shows long-run average and marginal cost for a typical firm in a perfectly competitive industry. The graph on the
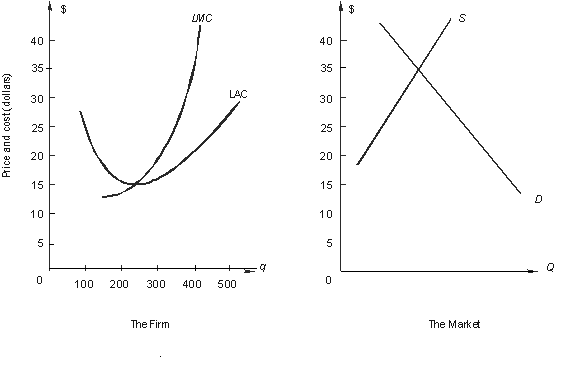
The graph on the left below shows long-run average and marginal cost for a typical firm in a perfectly competitive industry. The graph on the right shows demand and supply in the market. Show your answers on the graphs.
- What is the current price in the market?
- What output will maximize profits for the firm at this market price?
- How much profit will the firm earn at this market price?
- Is this a long-run equilibrium for a perfectly competitive firm? Why or why not? In not, what would be the price when the industry gets to long-run competitive equilibrium?
- Why can't firms in competitive industries make long-run economic profits?
\f
Step by Step Solution
There are 3 Steps involved in it
1 Expert Approved Answer
Step: 1 Unlock

Question Has Been Solved by an Expert!
Get step-by-step solutions from verified subject matter experts
Step: 2 Unlock
Step: 3 Unlock