

Question: The graph portrays the decision criterion for a hypothesis test for a population mean. The null hypothesis is Ho=Ho. The curve is the normal
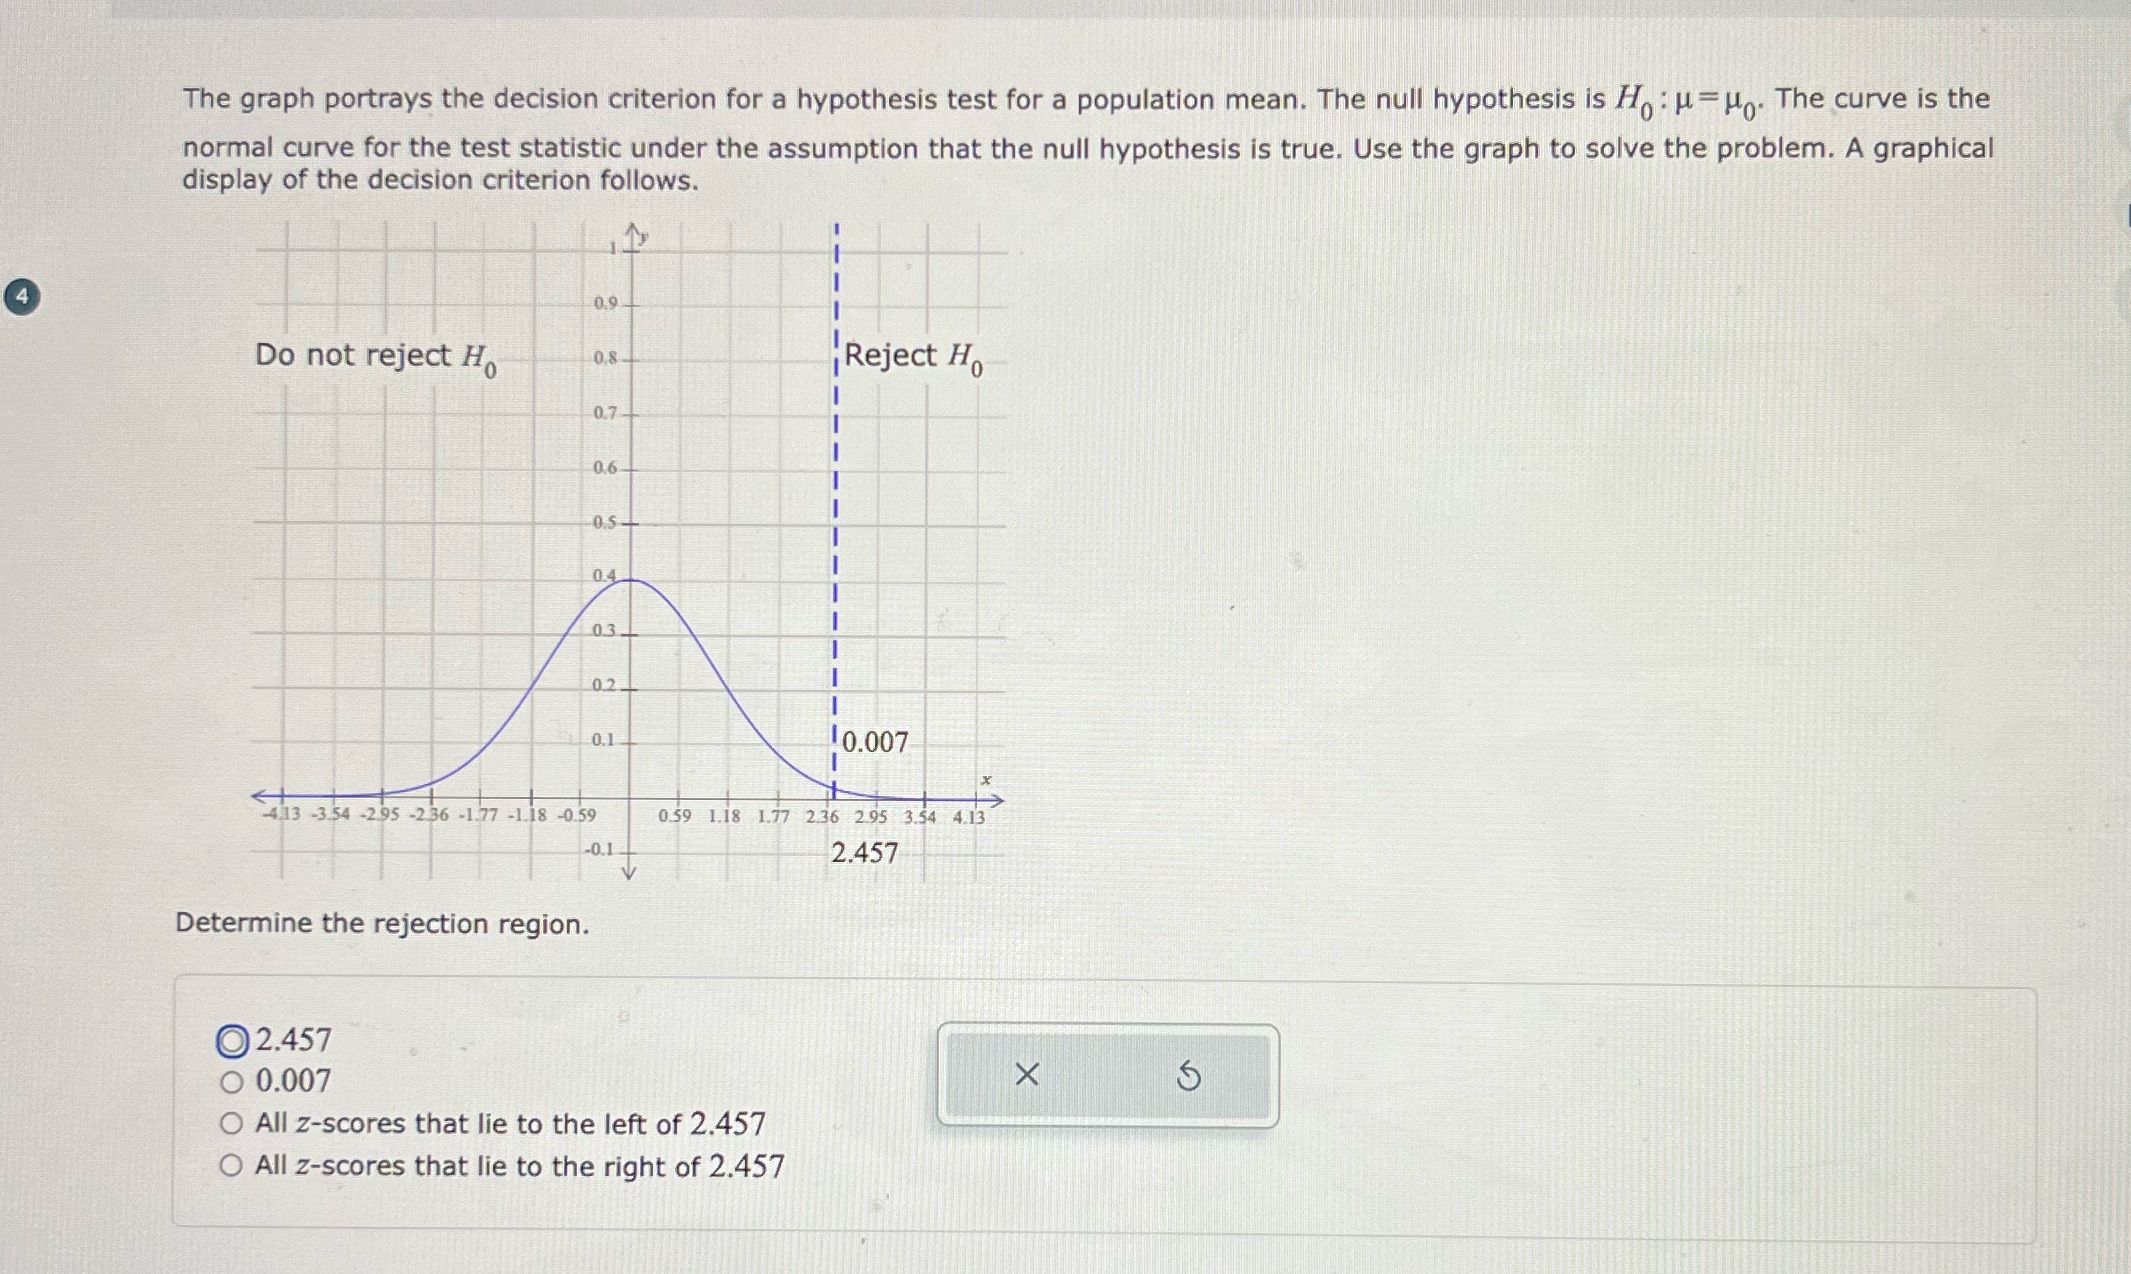
The graph portrays the decision criterion for a hypothesis test for a population mean. The null hypothesis is Ho=Ho. The curve is the normal curve for the test statistic under the assumption that the null hypothesis is true. Use the graph to solve the problem. A graphical display of the decision criterion follows. 4 0.9 Do not reject Ho 0.8 Reject Ho 0.7 -4.13 -3.54 -2.95 -2.36 -1.77 -1.18 -0.59 Determine the rejection region. 2.457 0.007 0.6 0.5 0.4 03 0.2 0.1 -0.1 10.007 0.59 1.18 1.77 2.36 2.95 3.54 4.13 2.457 All z-scores that lie to the left of 2.457 All z-scores that lie to the right of 2.457 x S
Step by Step Solution
There are 3 Steps involved in it

Get step-by-step solutions from verified subject matter experts