

Question: The graph shown in Figure represents a site - specific average design spectrum for elastoplastic structures with 2 % damping and a ductility factor of
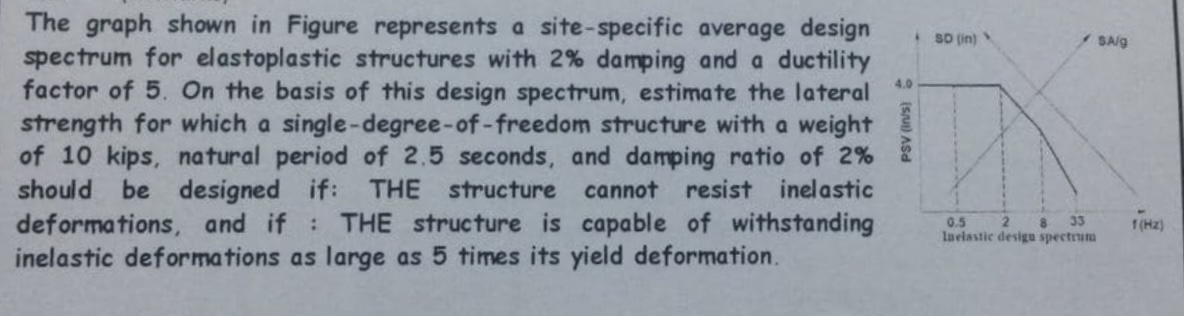
The graph shown in Figure represents a sitespecific average design spectrum for elastoplastic structures with damping and a ductility factor of On the basis of this design spectrum, estimate the lateral strength for which a singledegreeoffreedom structure with a weight of kips, natural period of seconds, and damping ratio of should be designed if: THE structure cannot resist inelastic deformations, and if : THE structure is capable of withstanding inelastic deformations as large as times its yield deformation.
Step by Step Solution
There are 3 Steps involved in it
1 Expert Approved Answer
Step: 1 Unlock

Question Has Been Solved by an Expert!
Get step-by-step solutions from verified subject matter experts
Step: 2 Unlock
Step: 3 Unlock