

Question: The graph shows average and marginal cost curves for a typical firm in a perfectly competitive industry in LONG-RUN equilibrium The long-run equilibrium price
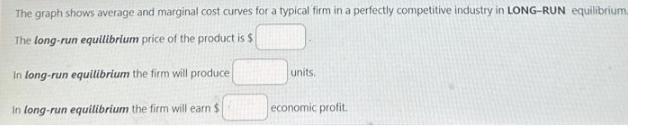
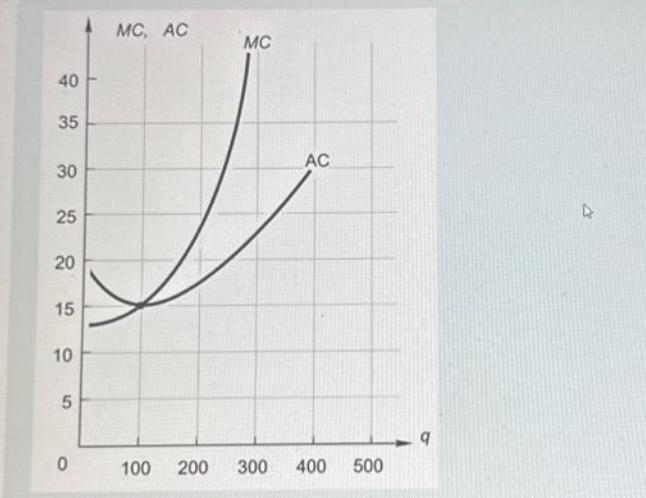
The graph shows average and marginal cost curves for a typical firm in a perfectly competitive industry in LONG-RUN equilibrium The long-run equilibrium price of the product is $ In long-run equilibrium the firm will produce. in long-run equilibrium the firm will earni units, economic profit. 40 35 30 25 20 15 10 5 0 MC, AC MC 100 200 300 AC 400 500 q
Step by Step Solution
★★★★★
3.54 Rating (151 Votes )
There are 3 Steps involved in it
1 Expert Approved Answer
Step: 1 Unlock

step... View full answer
Question Has Been Solved by an Expert!
Get step-by-step solutions from verified subject matter experts
Step: 2 Unlock
Step: 3 Unlock