

Question: The graph shows concentration as a function of time during a reaction of species Q and R to form species P. Select all the correct
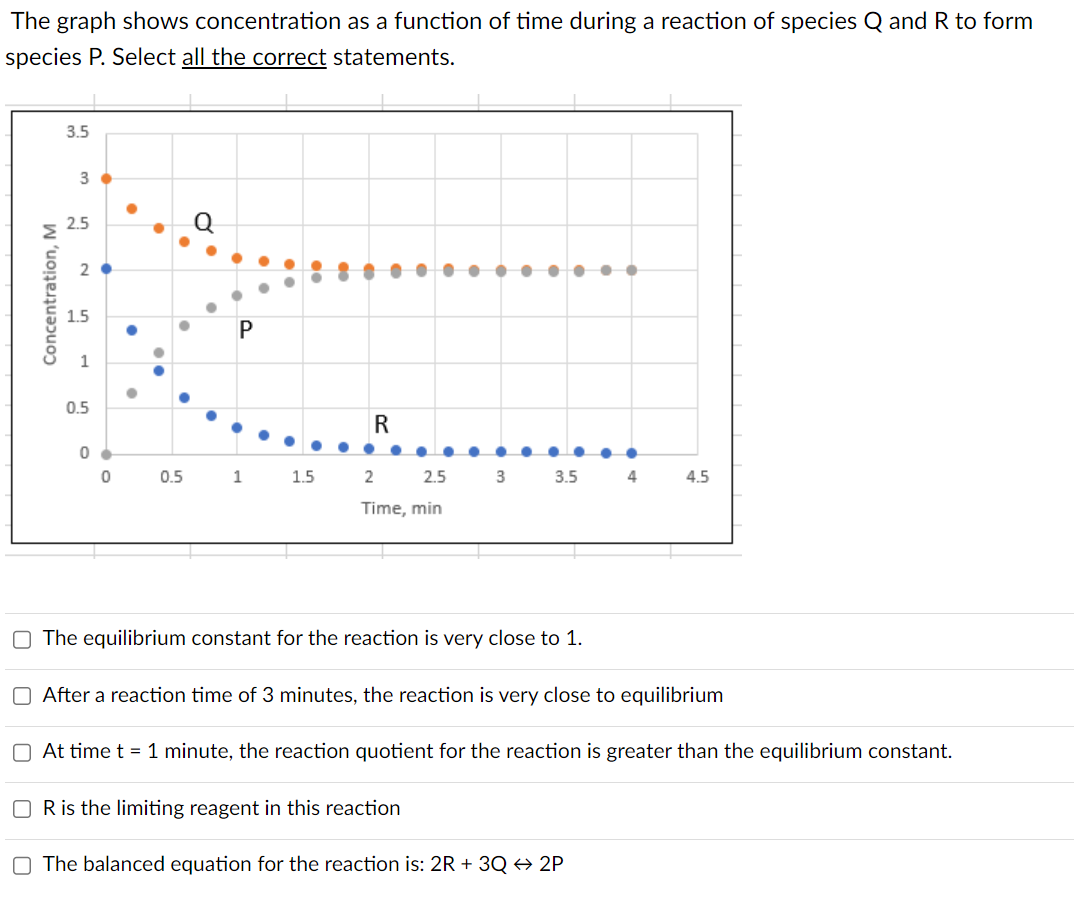
The graph shows concentration as a function of time during a reaction of species Q and R to form species P. Select all the correct statements. The equilibrium constant for the reaction is very close to 1. After a reaction time of 3 minutes, the reaction is very close to equilibrium At time t=1 minute, the reaction quotient for the reaction is greater than the equilibrium constant. R is the limiting reagent in this reaction The balanced equation for the reaction is: 2R+3Q2P
Step by Step Solution
There are 3 Steps involved in it
1 Expert Approved Answer
Step: 1 Unlock

Question Has Been Solved by an Expert!
Get step-by-step solutions from verified subject matter experts
Step: 2 Unlock
Step: 3 Unlock