

Question: The graph shows how the average surface water temperature f of Lake Michigan varies over the course of a year where t is measured in
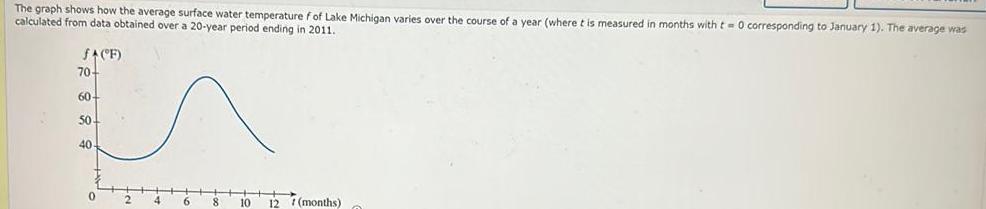

The graph shows how the average surface water temperature f of Lake Michigan varies over the course of a year where t is measured in months with t 0 corresponding to January 1 The average was calculated from data obtained over a 20 year period ending in 2011 f F 70 60 50 40 0 2 4 6 8 10 12 t months
Step by Step Solution
There are 3 Steps involved in it
1 Expert Approved Answer
Step: 1 Unlock

Question Has Been Solved by an Expert!
Get step-by-step solutions from verified subject matter experts
Step: 2 Unlock
Step: 3 Unlock