

Question: The graph shows the continuous function y=f(x) on [0, 11]. Use the graph to evaluate Sa f(x) da. V 20 9 13 8 11
![The graph shows the continuous function y=f(x) on [0, 11]. Use](https://s3.amazonaws.com/si.experts.images/answers/2024/06/667bf6411c427_000667bf640e3a17.jpg)
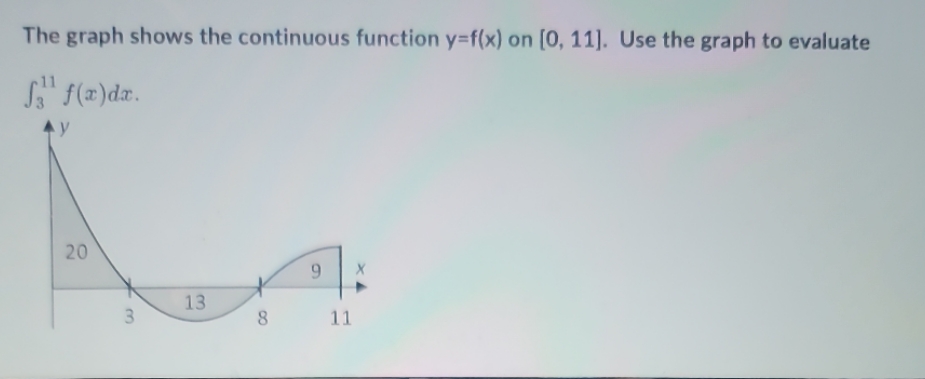
The graph shows the continuous function y=f(x) on [0, 11]. Use the graph to evaluate Sa f(x) da. V 20 9 13 8 11
Step by Step Solution
There are 3 Steps involved in it
1 Expert Approved Answer
Step: 1 Unlock

Question Has Been Solved by an Expert!
Get step-by-step solutions from verified subject matter experts
Step: 2 Unlock
Step: 3 Unlock