

Question: The graph shows the impedance as a function of frequency for a series RCL circuit. At what frequency does the inductor makes the largest contribution?
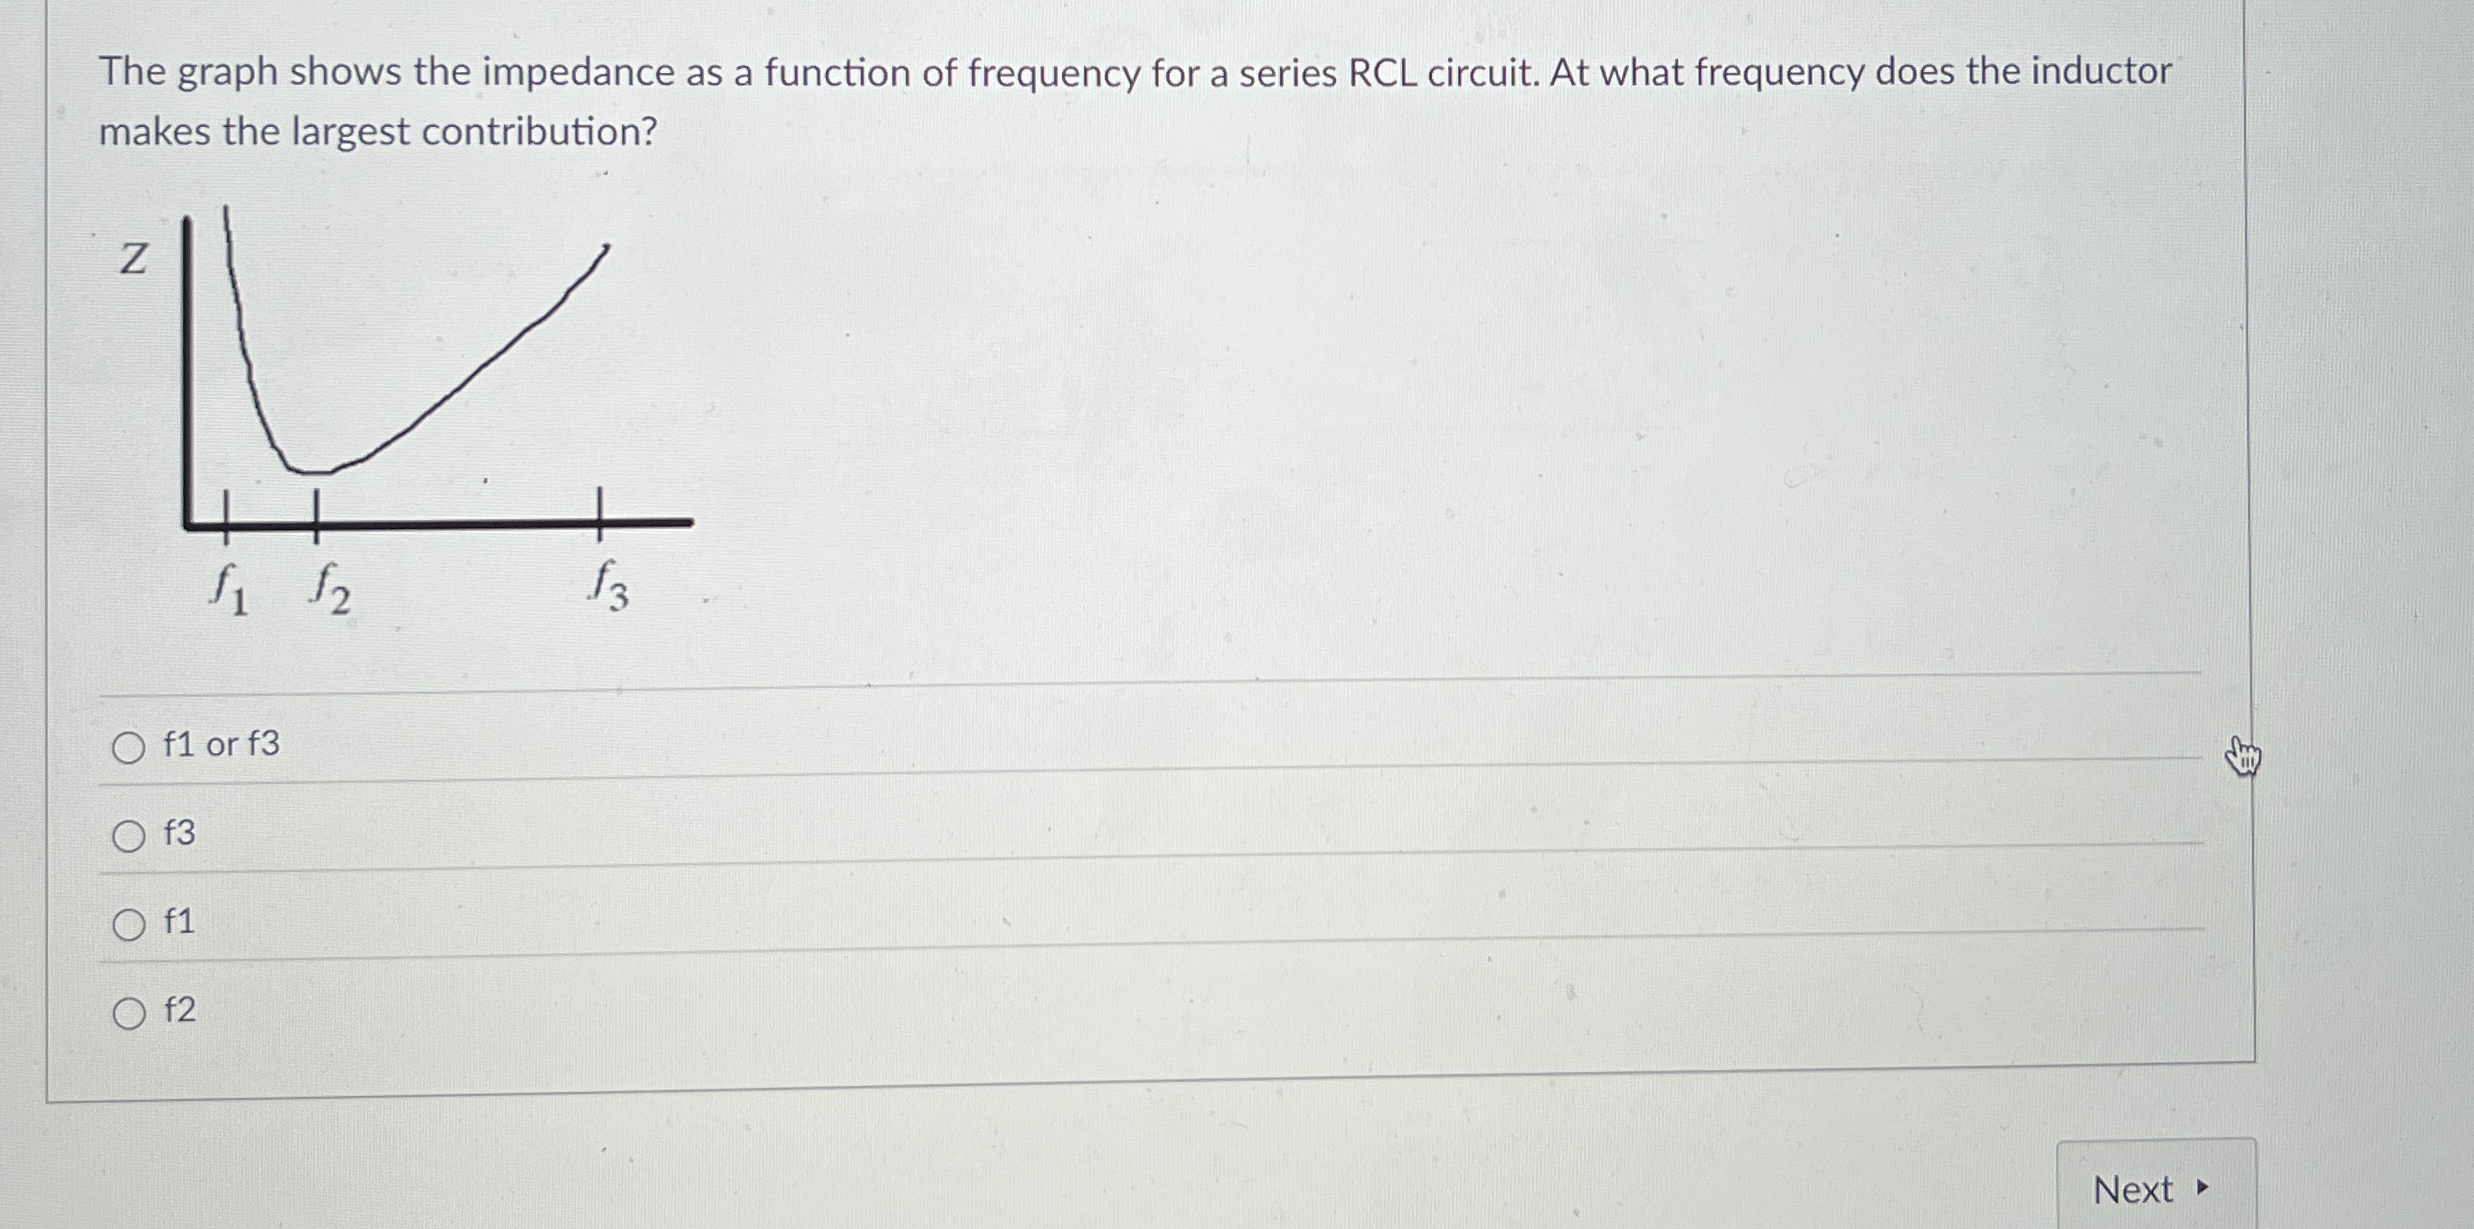
The graph shows the impedance as a function of frequency for a series RCL circuit. At what frequency does the inductor makes the largest contribution?
f or f
f
f
f
Step by Step Solution
There are 3 Steps involved in it
1 Expert Approved Answer
Step: 1 Unlock

Question Has Been Solved by an Expert!
Get step-by-step solutions from verified subject matter experts
Step: 2 Unlock
Step: 3 Unlock