

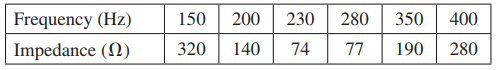
The table below shows the ratio of peak voltage to peak current that is, the impedance Z
Question:
The table below shows the ratio of peak voltage to peak current that is, the impedance Z as a function of frequency for a series RLC circuit. Plot the data and use your graph to estimate(a) the resonant frequency ?(b) the resistance
Fantastic news! We've Found the answer you've been seeking!
Step by Step Answer:
Given info The data of frequency and corresponding impedance of the RLC circuit is given in the tabl...View the full answer

Answered By
Kashif Qamar
Learning entails sharing as well. Being a student, I have been sharing my knowledge since high school times because this is what enriches me. I have been on Chegg as a tutor for a long time and also provide lessons to some other students at my localities. Currently, I am also working as a Chemistry and Biology expert at Bartleby.
0 Reviews
10+ Question Solved
Related Book For 
Question Posted:
