

The graph shows the market for bottled water. Draw a point at the equilibrium price and equilibrium
Fantastic news! We've Found the answer you've been seeking!
Question:
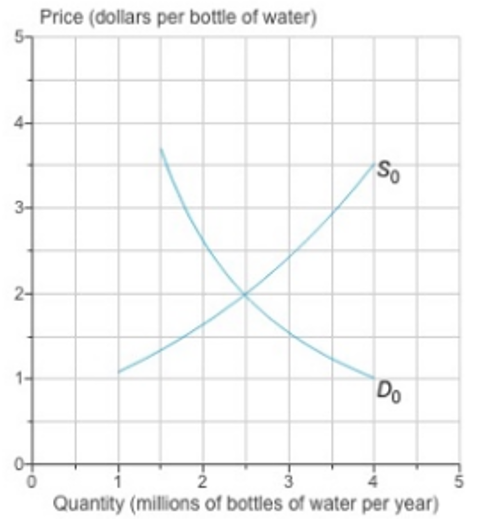
The graph shows the market for bottled water.
Draw a point at the equilibrium price and equilibrium quantity of bottled water Label it 1
Draw a new demand curve that shows what happen in the market for bottled water if the price of a gym membership rises. Label it D 1 .
Draw a new supply curve that shows fewer firms in the bottle of water market. Label it S 1 .
Draw a point at the new equilibrium price and equilibrium quantity of bottled water Label it 2.
Draw only the object specified in the question.
Expert Answer:

Related Book For 

Posted Date:
