

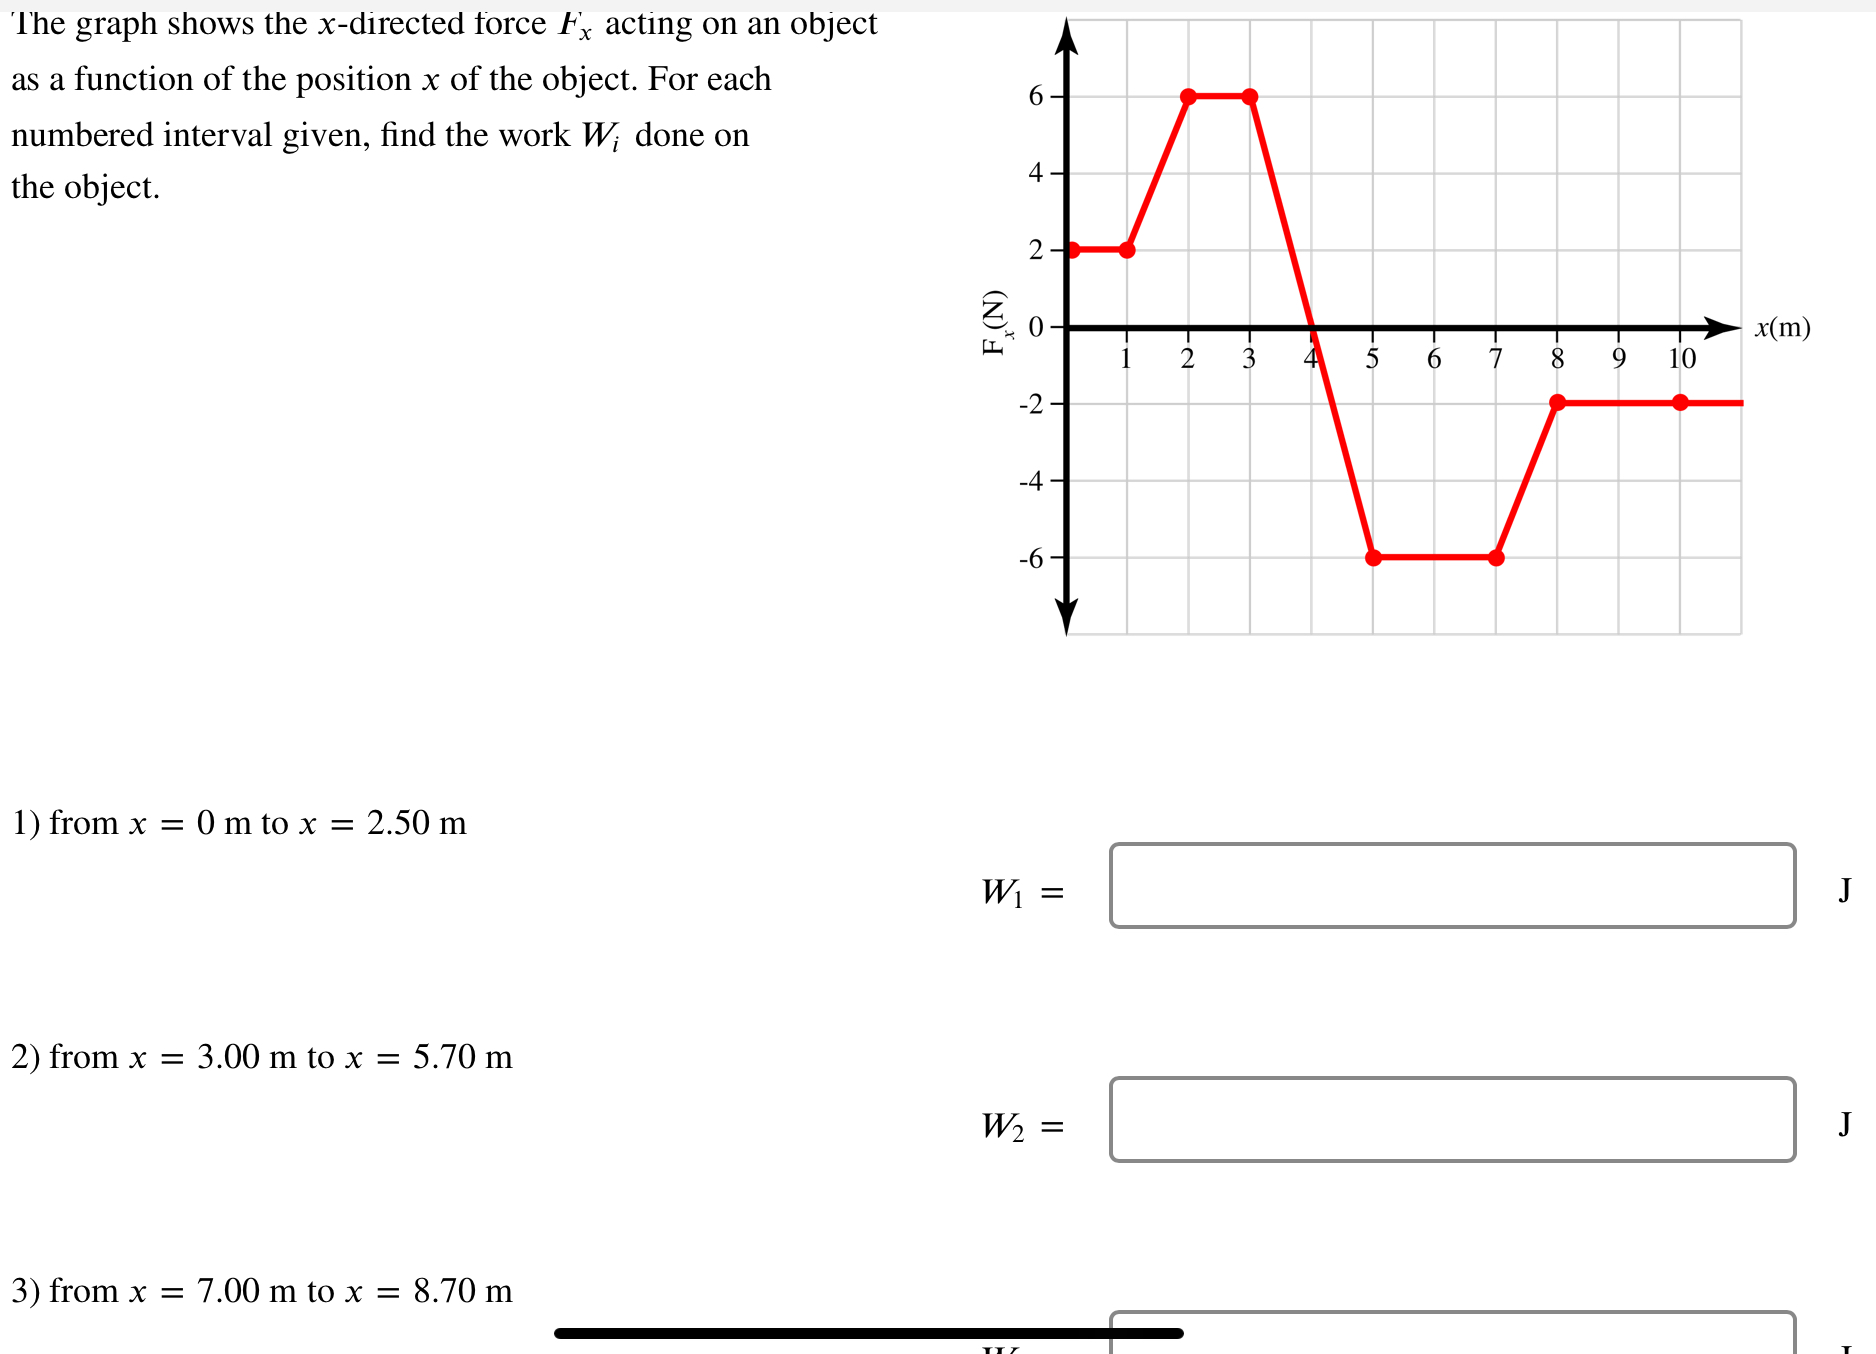
Question: The graph shows the x - directed force F x acting on an object as a function of the position x of the object. For
The graph shows the directed force acting on an object
as a function of the position of the object. For each
numbered interval given, find the work done on
the object.
from to
from to
from to
Step by Step Solution
There are 3 Steps involved in it
1 Expert Approved Answer
Step: 1 Unlock

Question Has Been Solved by an Expert!
Get step-by-step solutions from verified subject matter experts
Step: 2 Unlock
Step: 3 Unlock