

Question: The graph to the right illustrates the static AD-AS model. + 122- SRAS2 Suppose the economy is initially in long-run equilibrium at point A. 120-
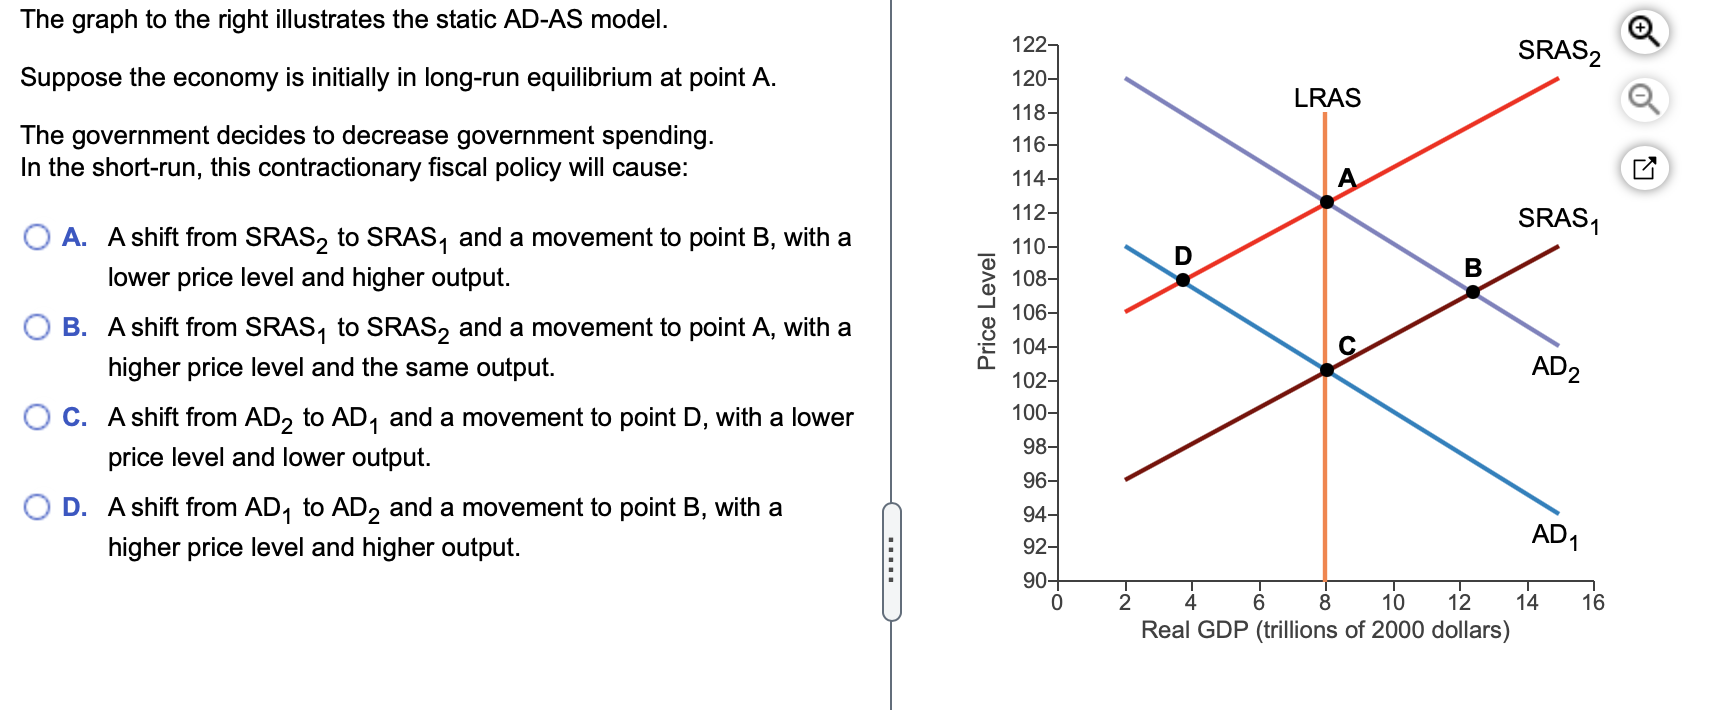
The graph to the right illustrates the static AD-AS model. + 122- SRAS2 Suppose the economy is initially in long-run equilibrium at point A. 120- 118- LRAS The government decides to decrease government spending. 116- In the short-run, this contractionary fiscal policy will cause: 114- A 112- SRAS1 O A. A shift from SRAS2 to SRAS, and a movement to point B, with a 110- D lower price level and higher output. 108- B Price Level O B. A shift from SRAS, to SRAS2 and a movement to point A, with a 106- 104- C higher price level and the same output. 102- AD2 O C. A shift from AD2 to AD, and a movement to point D, with a lower 100- price level and lower output. 98- 96- O D. A shift from AD, to AD2 and a movement to point B, with a 94- higher price level and higher output. 92- AD 1 90+ N- 6 8 10 12 14 16 Real GDP (trillions of 2000 dollars)
Step by Step Solution
There are 3 Steps involved in it

Get step-by-step solutions from verified subject matter experts