

Question: The graph to the right is the uniform probability density function for a friend who is x minutes late. (a) Find the probability that the
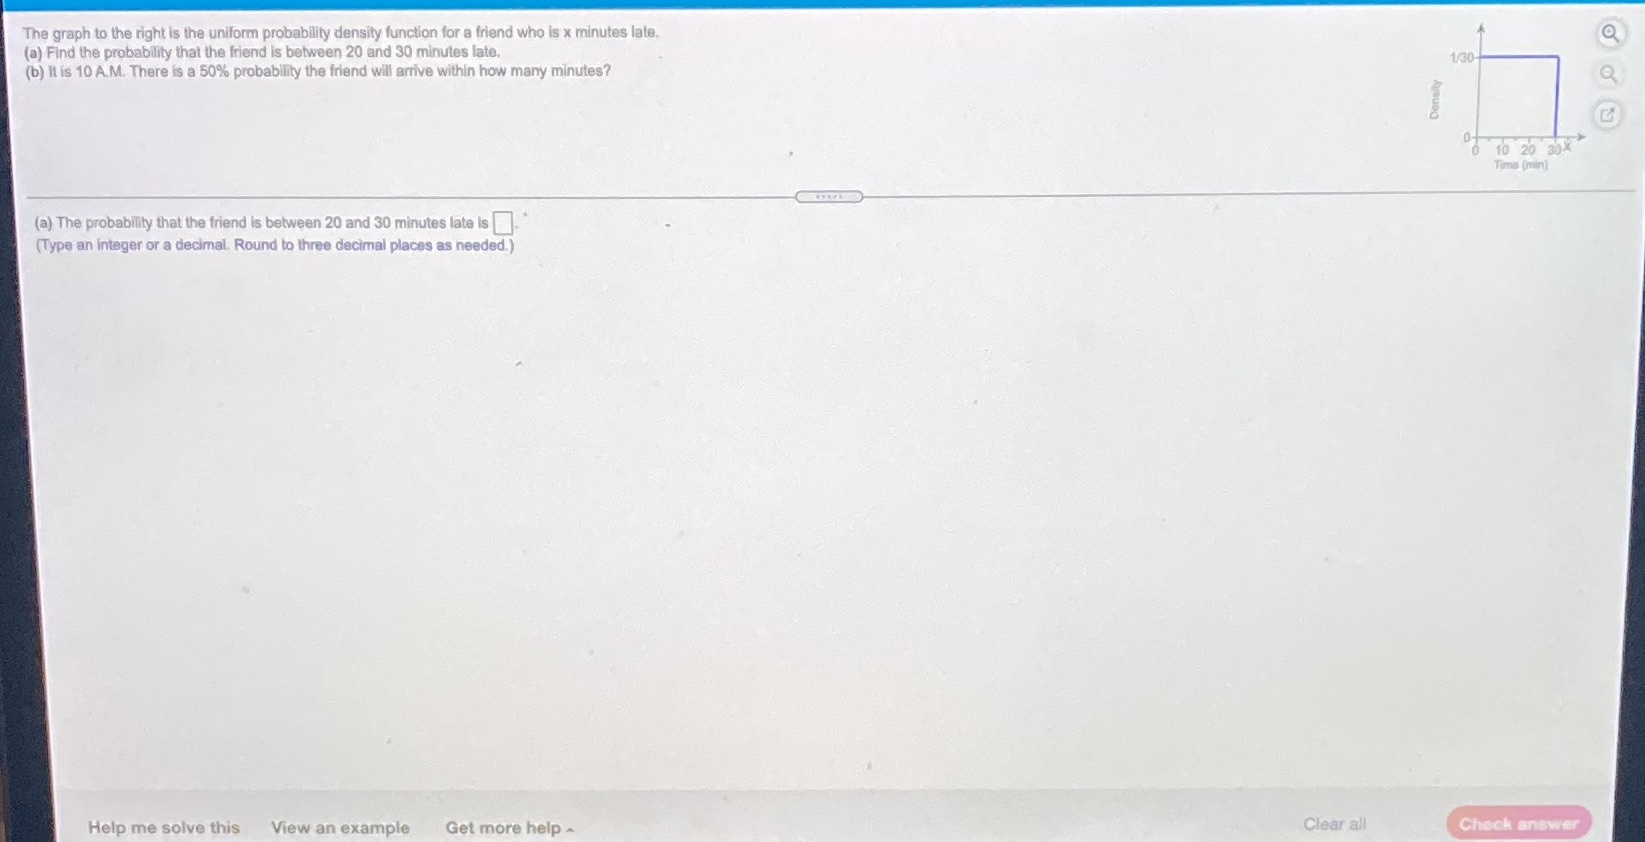
The graph to the right is the uniform probability density function for a friend who is x minutes late. (a) Find the probability that the friend is between 20 and 30 minutes late. 1/30- (b) It is 10 A.M. There is a 50% probability the friend will arrive within how many minutes? Density 10 20 30X Time (min) (a) The probability that the friend is between 20 and 30 minutes late is (Type an integer or a decimal. Round to three decimal places as needed.) Help me solve this View an example Get more help - Clear all Check
Step by Step Solution
There are 3 Steps involved in it
1 Expert Approved Answer
Step: 1 Unlock

Question Has Been Solved by an Expert!
Get step-by-step solutions from verified subject matter experts
Step: 2 Unlock
Step: 3 Unlock