

Question: The graph to the right is the uniform probability density function for a friend who is x minutes late a Find the probability that the
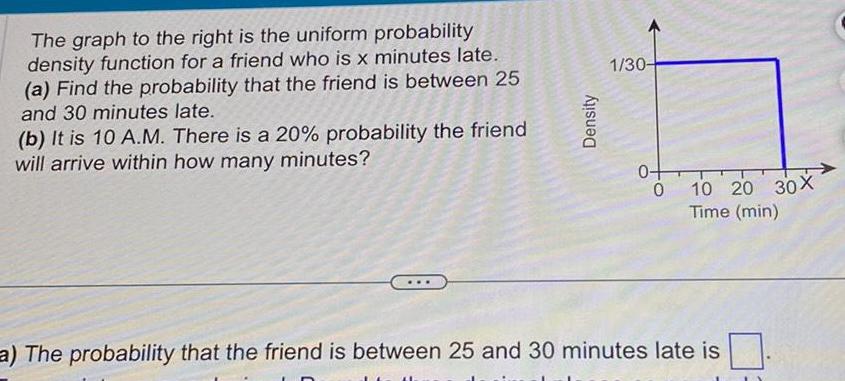

The graph to the right is the uniform probability density function for a friend who is x minutes late a Find the probability that the friend is between 25 and 30 minutes late b It is 10 A M There is a 20 probability the friend will arrive within how many minutes Density 1 30 0 0 10 20 30X Time min a The probability that the friend is between 25 and 30 minutes late is
Step by Step Solution
There are 3 Steps involved in it
1 Expert Approved Answer
Step: 1 Unlock

Question Has Been Solved by an Expert!
Get step-by-step solutions from verified subject matter experts
Step: 2 Unlock
Step: 3 Unlock