

Question: the graph two question The following graphs show the relationship between the price of cherries and the quantity of cherries supplied in two different regions,

the graph two question
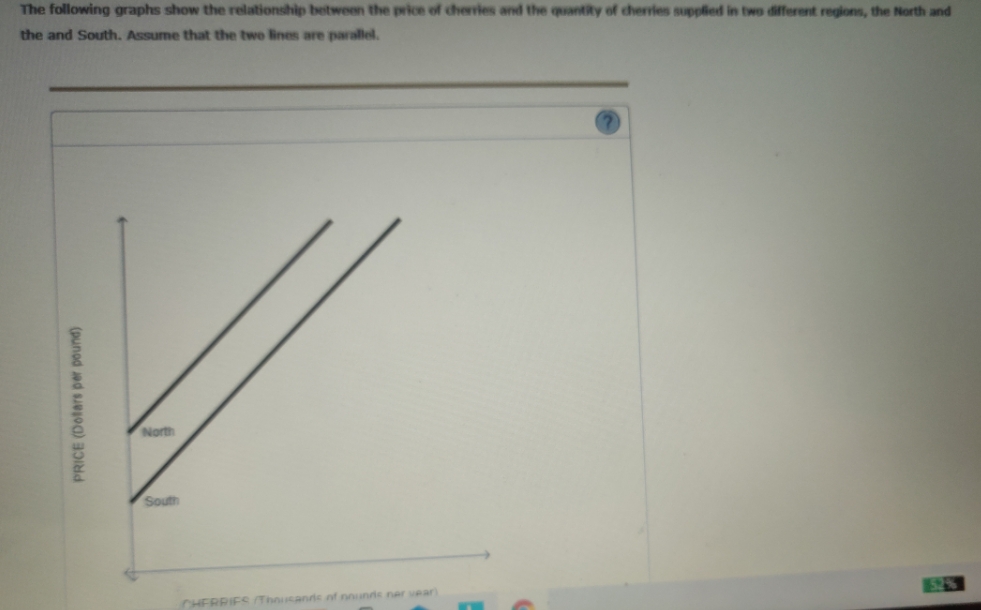
The following graphs show the relationship between the price of cherries and the quantity of cherries supplied in two different regions, the North and the and South. Assume that the two lines are parallel PRICE (Dollars per pound) South RPIFS (Thousands of nunnis ner wear)
Step by Step Solution
There are 3 Steps involved in it
1 Expert Approved Answer
Step: 1 Unlock

Question Has Been Solved by an Expert!
Get step-by-step solutions from verified subject matter experts
Step: 2 Unlock
Step: 3 Unlock