

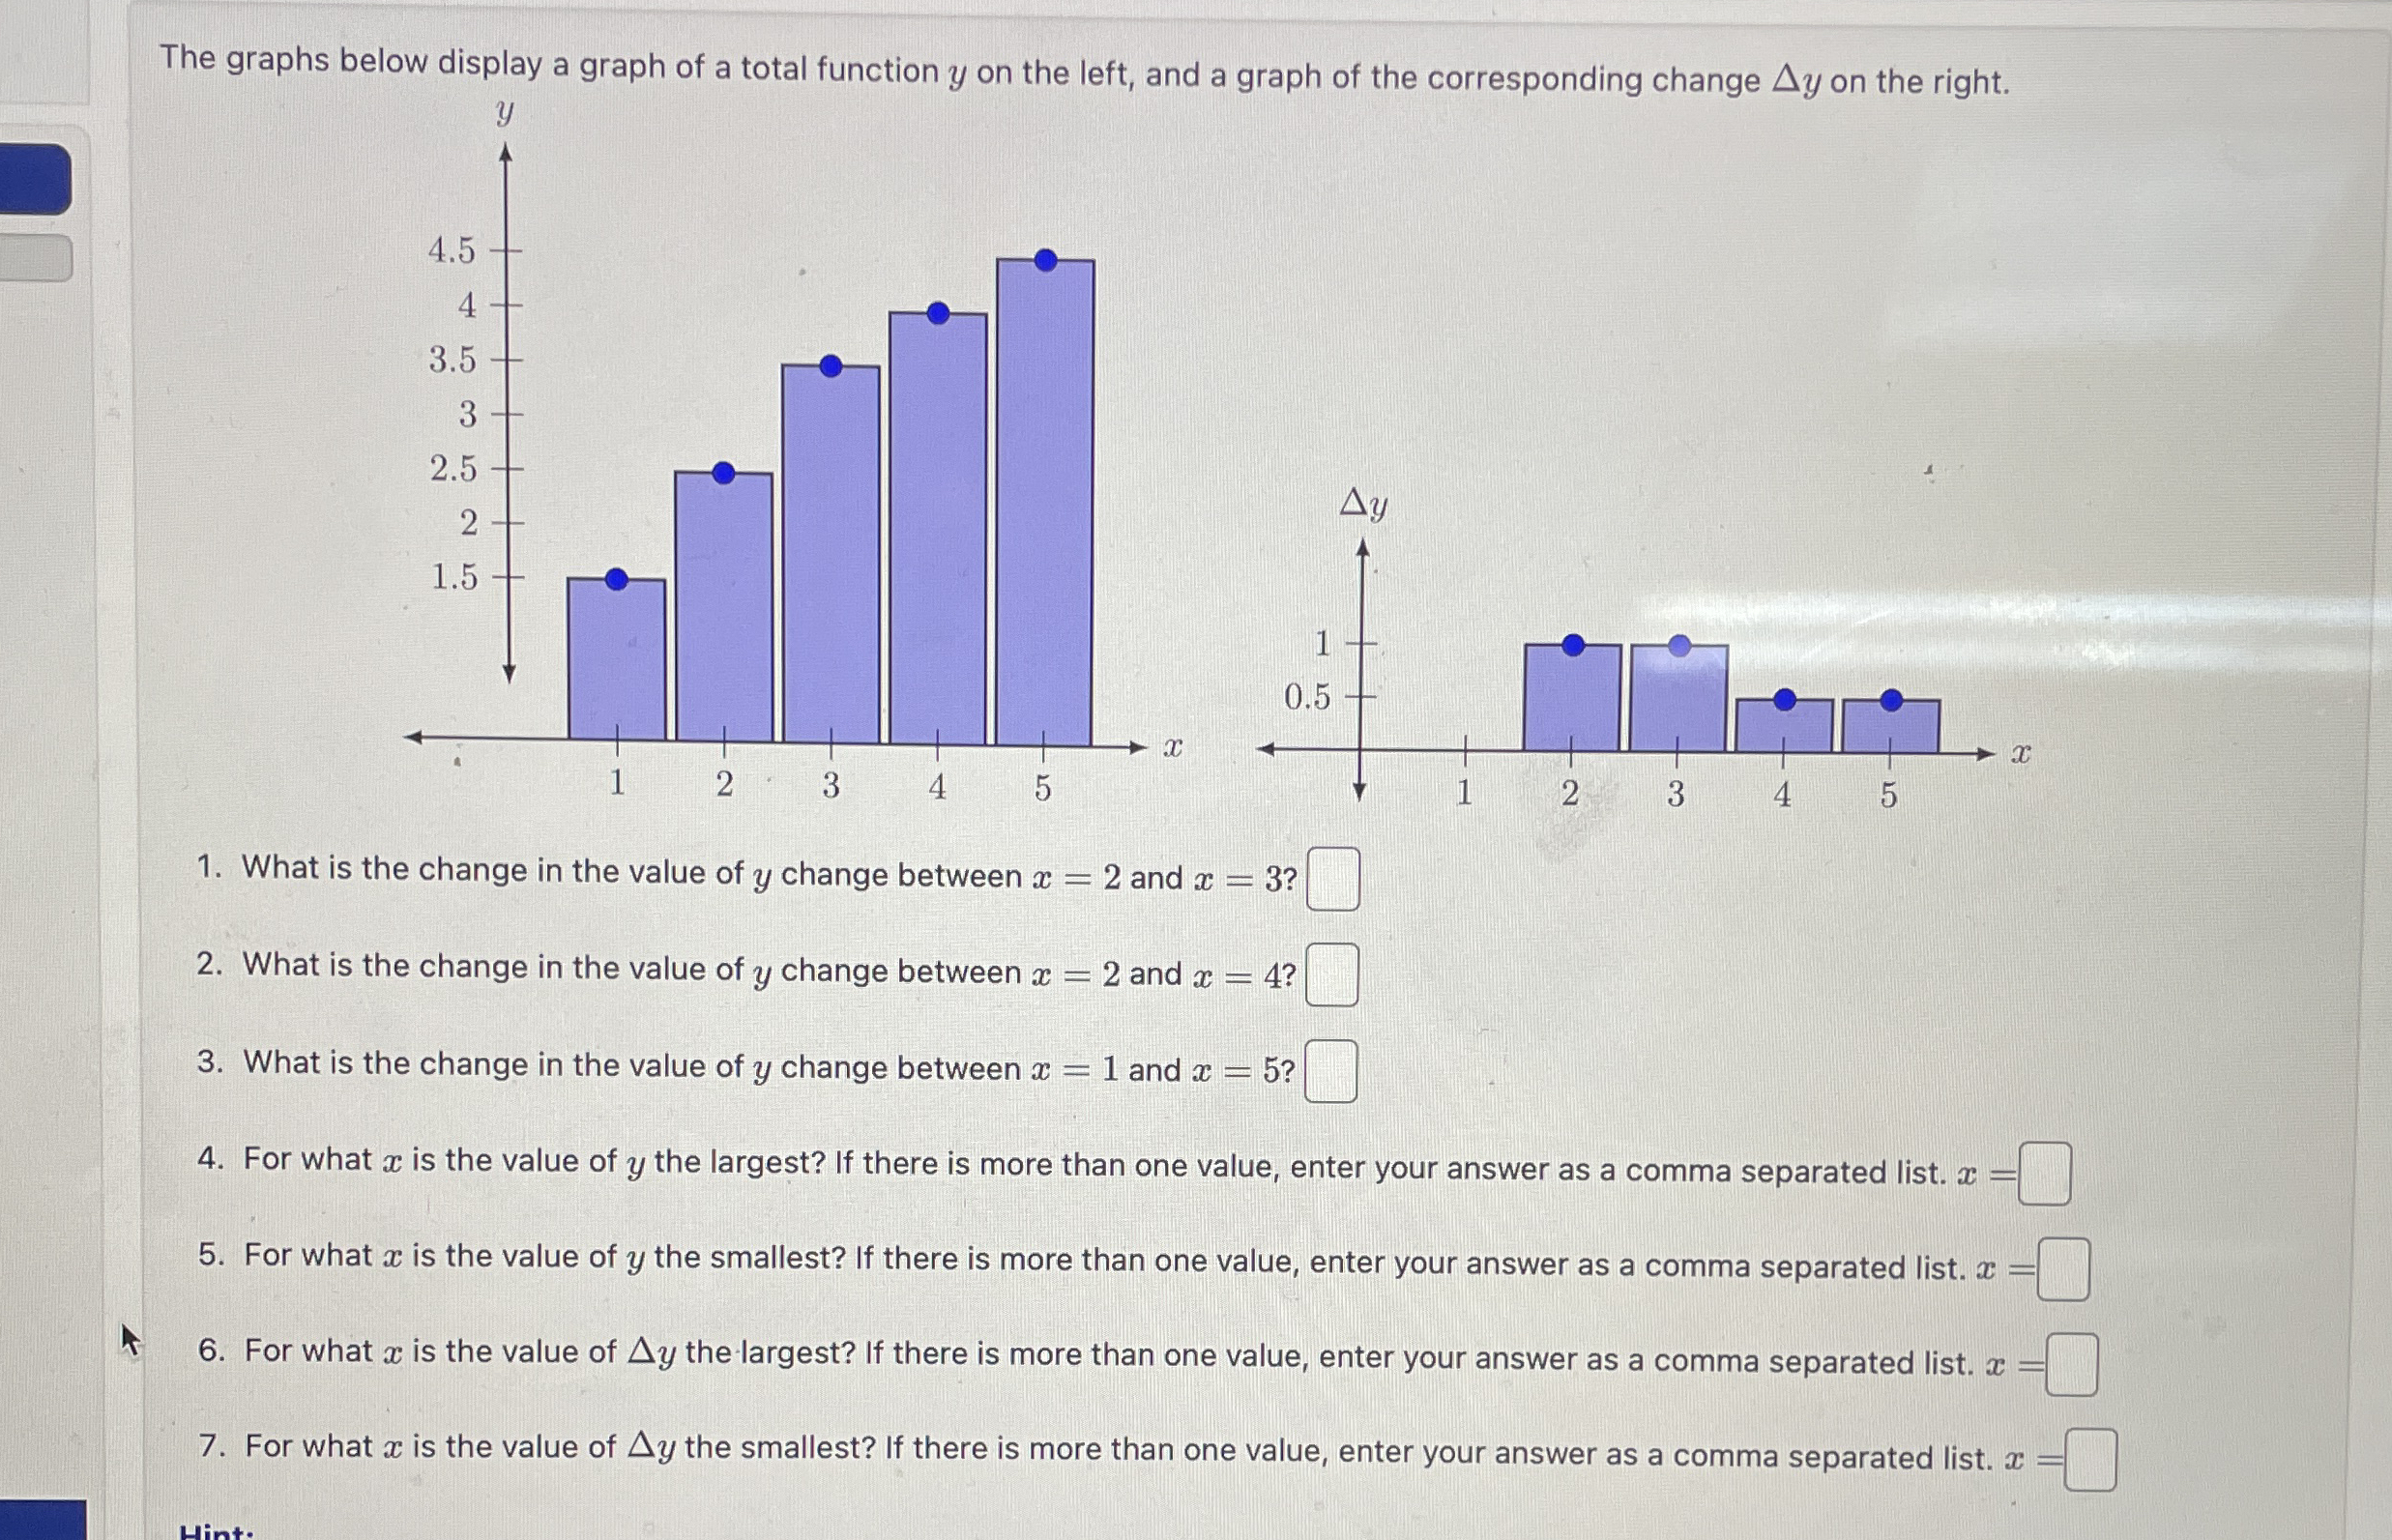
Question: The graphs below display a graph of a total function y on the left, and a graph of the corresponding change y on the right.
The graphs below display a graph of a total function on the left, and a graph of the corresponding change on the right.
What is the change in the value of change between and
What is the change in the value of change between and
What is the change in the value of change between and
For what is the value of the largest? If there is more than one value, enter your answer as a comma separated list.
For what is the value of the smallest? If there is more than one value, enter your answer as a comma separated list.
For what is the value of the largest? If there is more than one value, enter your answer as a comma separated list.
For what is the value of the smallest? If there is more than one value, enter your answer as a comma separated list.
Step by Step Solution
There are 3 Steps involved in it
1 Expert Approved Answer
Step: 1 Unlock

Question Has Been Solved by an Expert!
Get step-by-step solutions from verified subject matter experts
Step: 2 Unlock
Step: 3 Unlock