

Question: The graphs below explore relationships between units sold and each of the other variables. Units Sold by Average Retail Price Per Store per Week Average
- The graphs below explore relationships between units sold and each of the other variables.
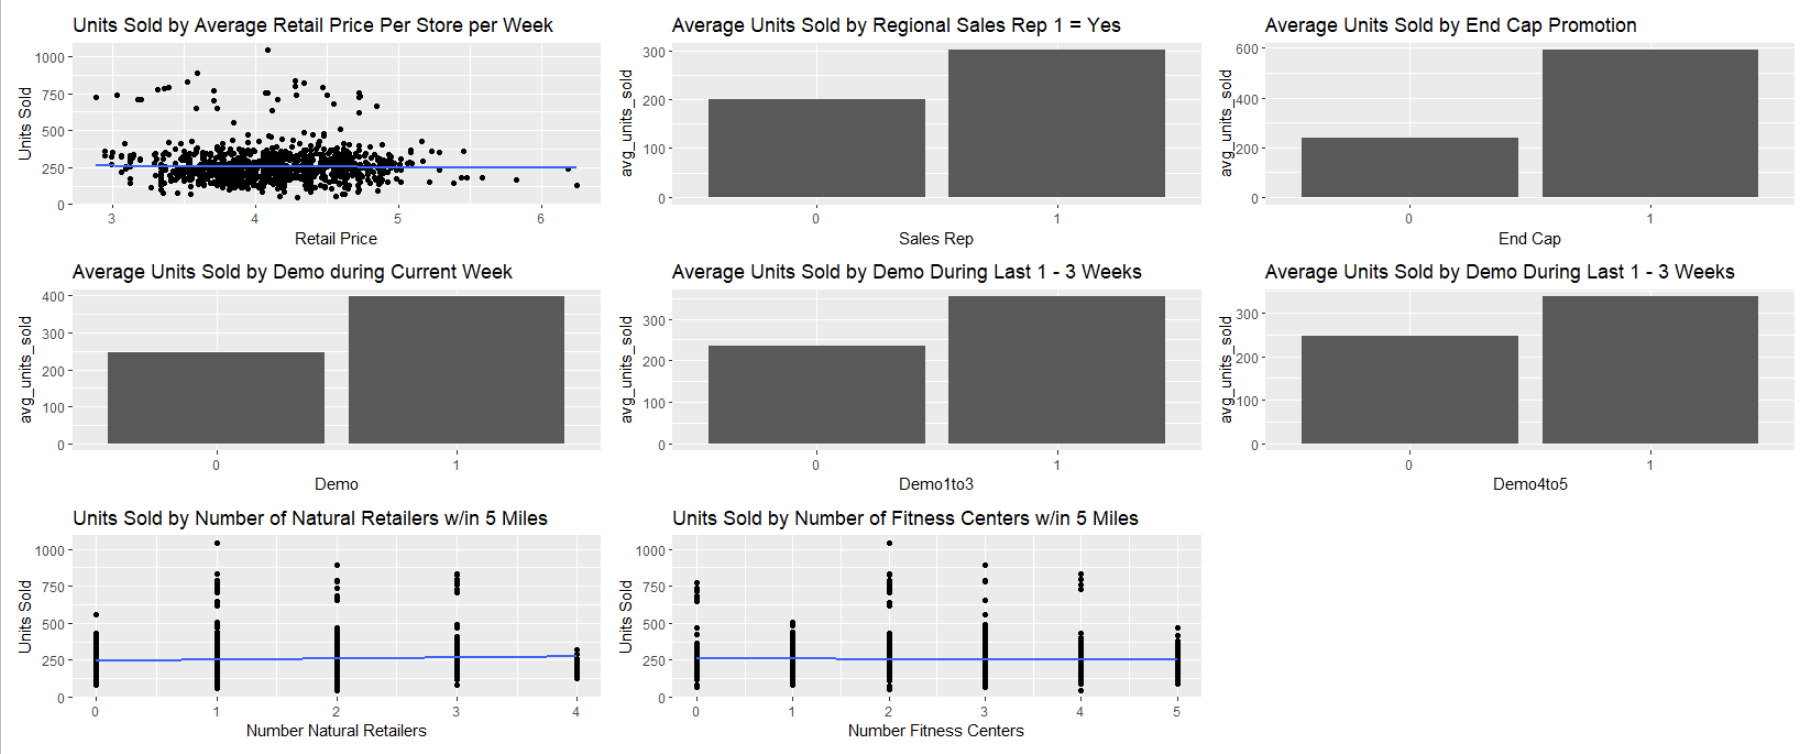
Units Sold by Average Retail Price Per Store per Week Average Units Sold by Regional Sales Rep 1 = Yes Average Units Sold by End Cap Promotion 1000 300 600 750 200 400 avg_units_sold Units Sold avg_units_sold 500 100 200 250 0 6 Retail Price Sales Rep End Cap Average Units Sold by Demo during Current Week Average Units Sold by Demo During Last 1 - 3 Weeks Average Units Sold by Demo During Last 1 - 3 Weeks 400 300 300 300 200 avg_units_sold 200 2 2 avg_units_sold 100 100 5)100 ava 0 0 . O - Demo Demo 1to3 Demo4to5 Units Sold by Number of Natural Retailers w/in 5 Miles Units Sold by Number of Fitness Centers w/in 5 Miles 1000 - 1000 -. 750 750- Units Sold Units Sold 500 - 500 250 250 Number Natural Retailers Number Fitness Centers
Step by Step Solution
There are 3 Steps involved in it

Get step-by-step solutions from verified subject matter experts