

Question: The graphs in the figure below represent the velocity, V, of a particle moving along the x-axis for time 0 S t S 5. The
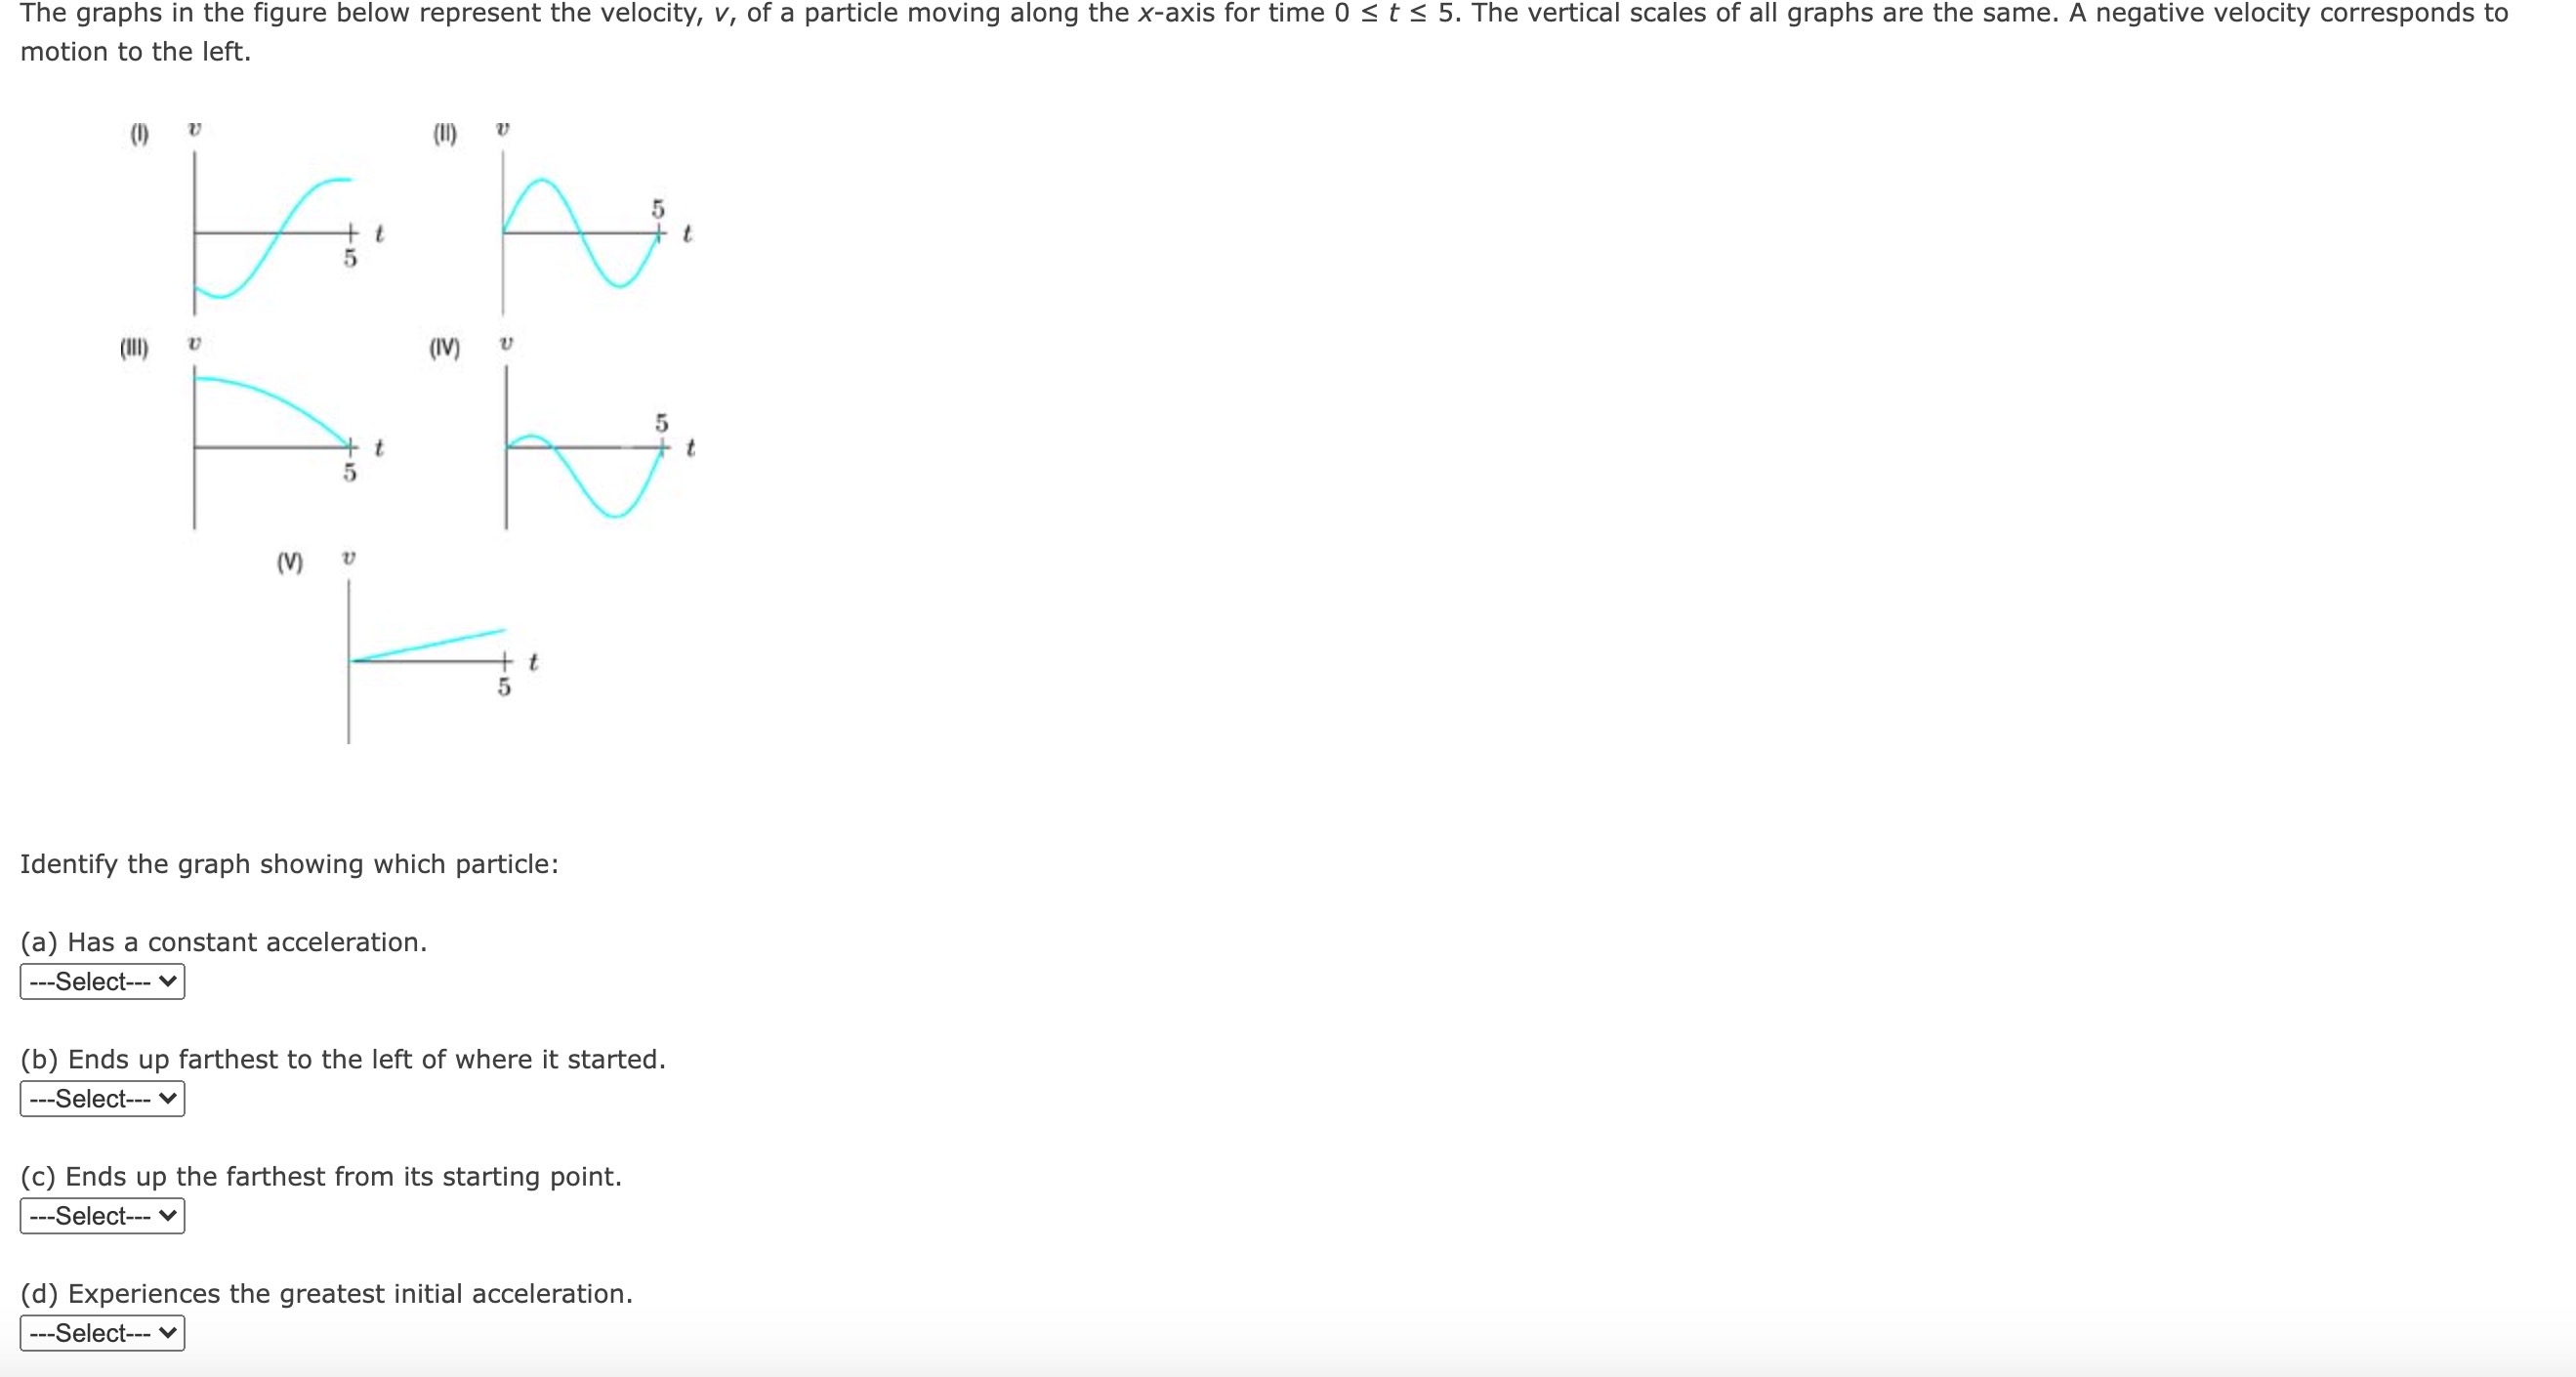

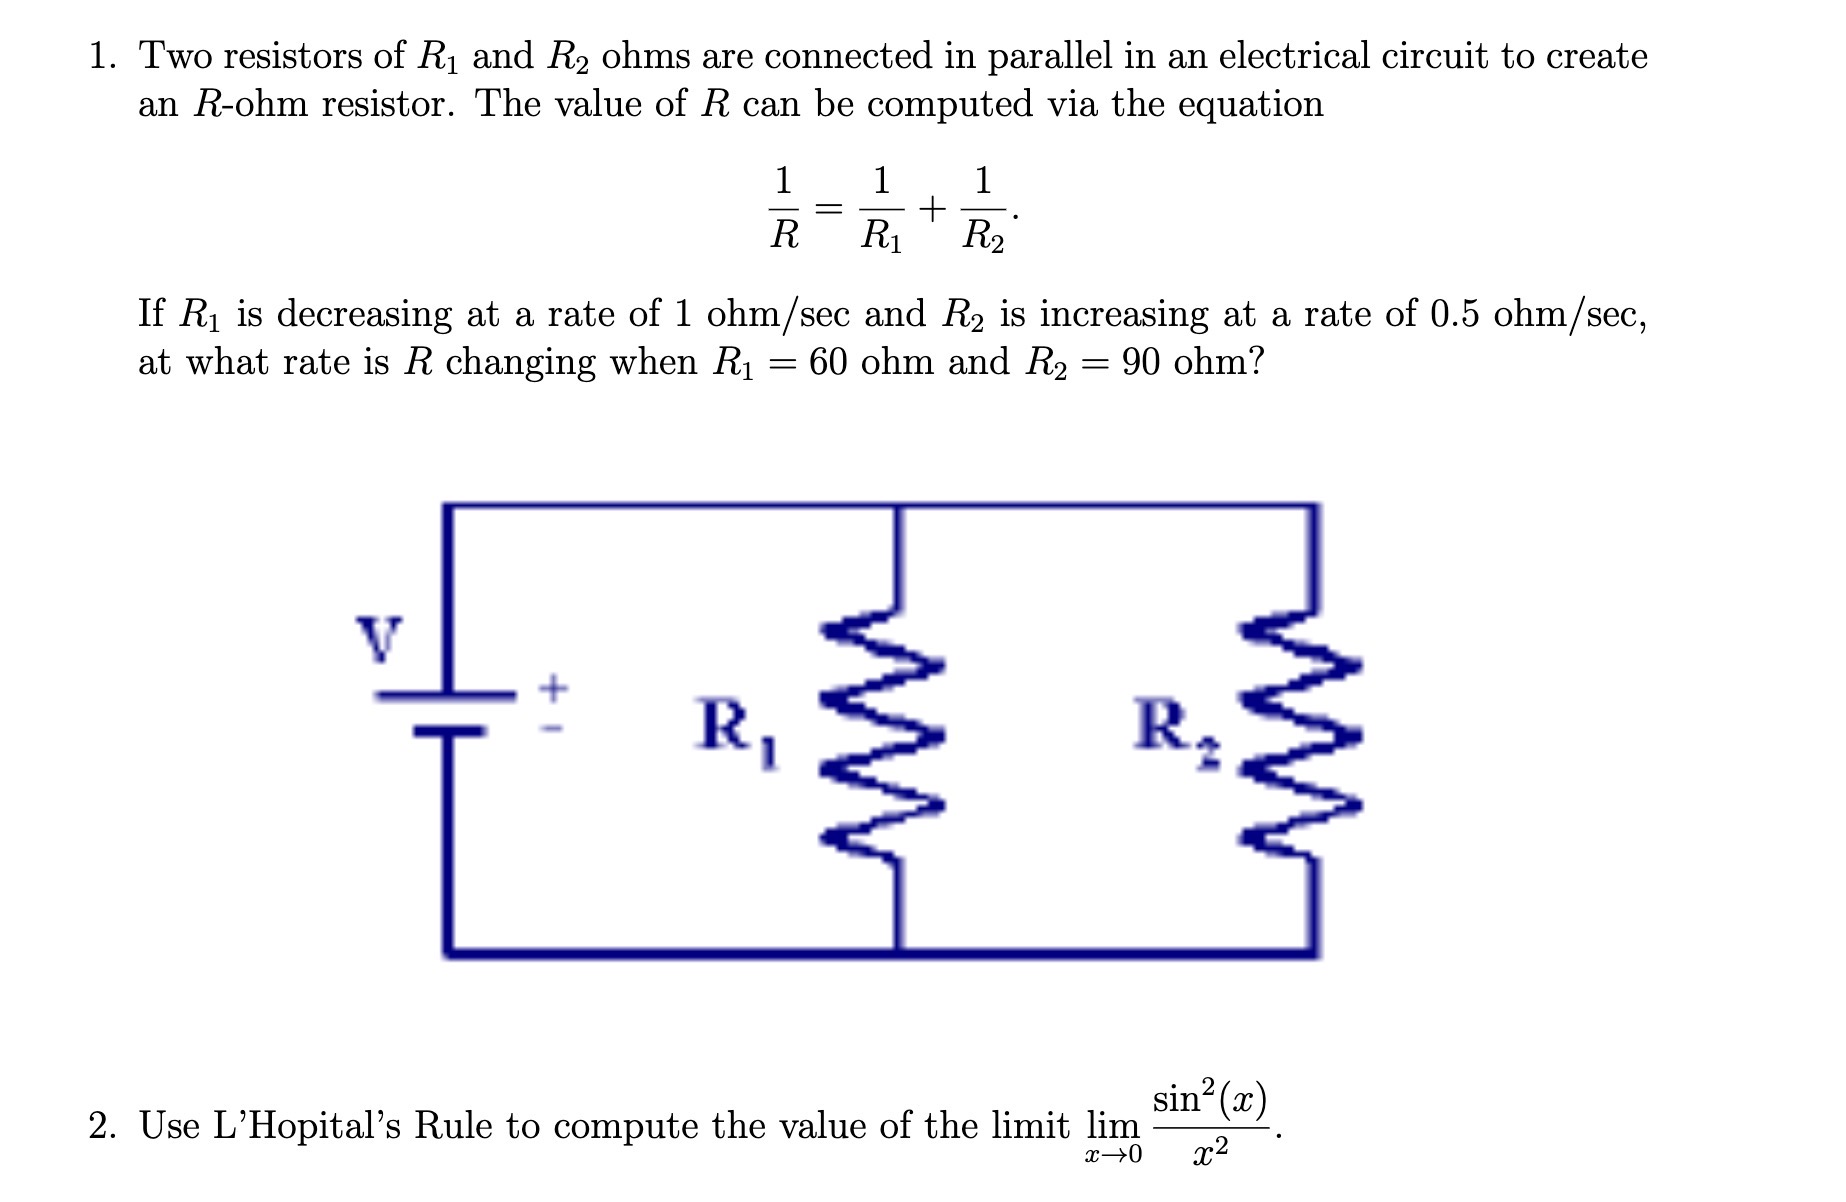

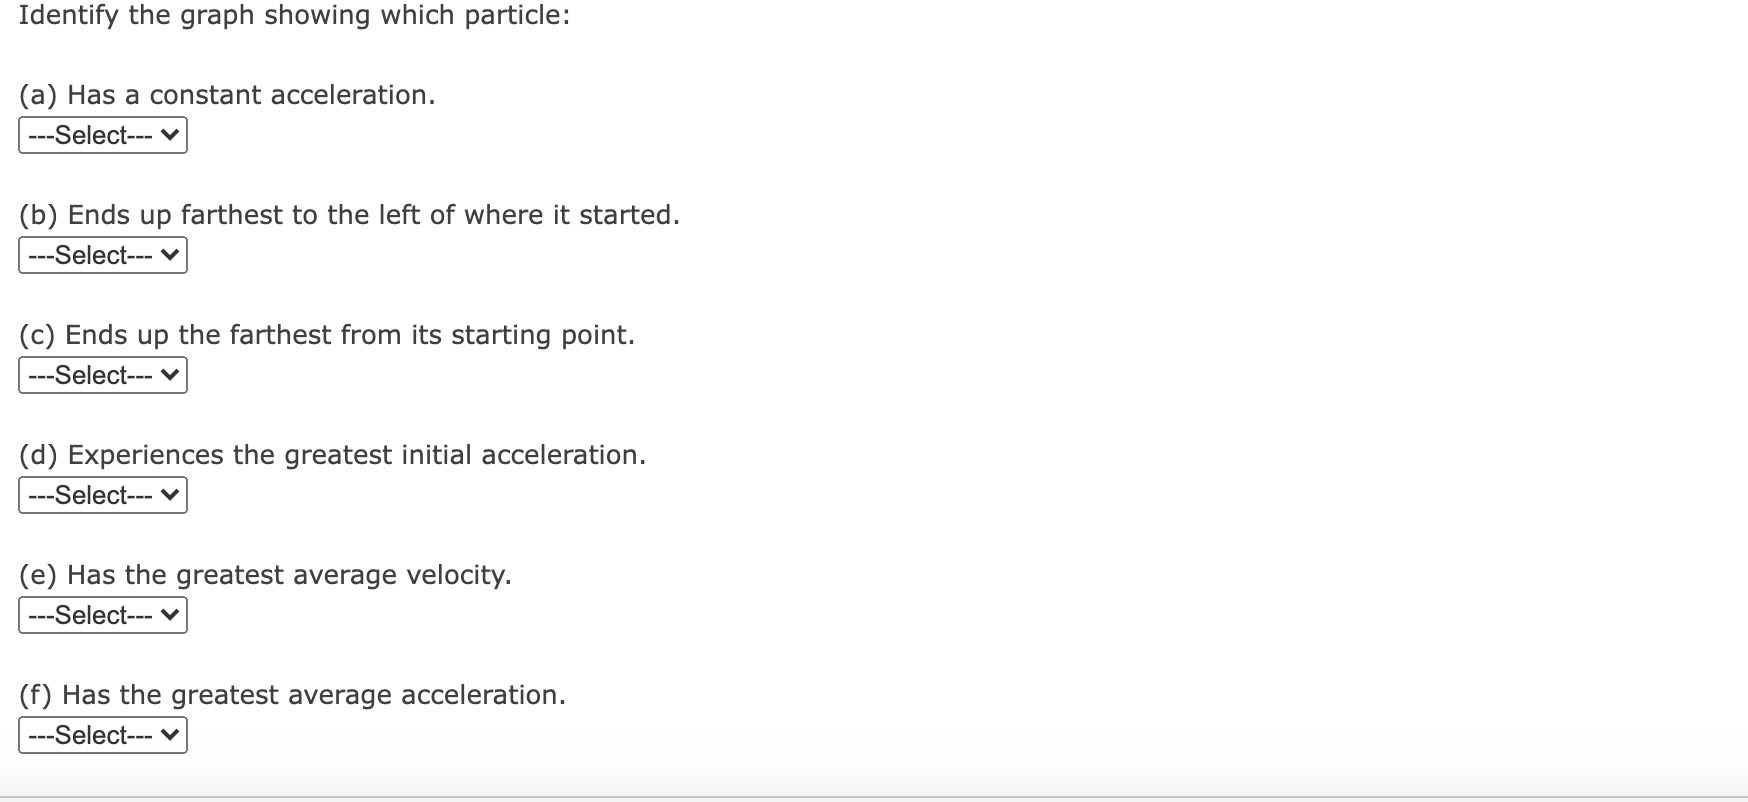

The graphs in the figure below represent the velocity, V, of a particle moving along the x-axis for time 0 S t S 5. The vertical scales of all graphs are the same. A negative velocity corresponds to motion to the left. (I) " (ll) " Identify the graph showing which particle: (a) Has a constant acceleration. ---Select-- V (b) Ends up farthest to the left of where it started. ---Se|ect-- v (c) Ends up the farthest from its starting point. ---Se|ect-- v (d) Experiences the greatest initial acceleration. --Select v \f1. Two resistors of R1 and R2 ohms are connected in parallel in an electrical circuit to create an Rohm resistor. The value of R can be computed via the equation 1 _ 1 + 1 R _ R1 R; If R1 is decreasing at a rate of 1 ohm/ sec and R2 is increasing at a rate of 0.5 ohm/sec, at What rate is R changing when R1 = 60 ohm and R2 = 90 ohm? sin2 (an) 2. Use L'Hopital's Rule to compute the value of the limit 1inr(1J x2 m)
Step by Step Solution
There are 3 Steps involved in it

Get step-by-step solutions from verified subject matter experts