

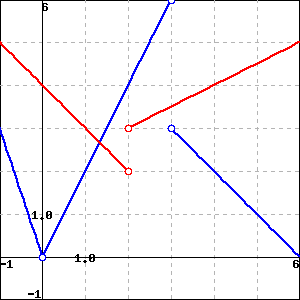
The graphs of the function f (given in blue) and g (given in red) are plotted...
Fantastic news! We've Found the answer you've been seeking!
Question:

Expert Answer:
First lets look at the two functions fx and gx We can see that they are not continuous functions and ... View the full answer

Related Book For 

Posted Date:
