

Question: Graph the expectation function for the logistic growth model (12.34) for (theta_{1}=10, theta_{2}=2), and values of (theta_{3}=0.25,1,2,3), respectively. Overlay these plots on the same set
Graph the expectation function for the logistic growth model (12.34) for \(\theta_{1}=10, \theta_{2}=2\), and values of \(\theta_{3}=0.25,1,2,3\), respectively. Overlay these plots on the same set of \(x-y\) axes. What effect does the parameter \(\theta_{3}\) have on the expectation function?
Equation (12.34)
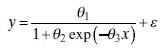
y= 01 1+0 exp(-03x) +
Step by Step Solution
There are 3 Steps involved in it
1 Expert Approved Answer
Step: 1 Unlock

Question Has Been Solved by an Expert!
Get step-by-step solutions from verified subject matter experts
Step: 2 Unlock
Step: 3 Unlock