

Question: The graphs on the right illustrate the iS-LM-PC model with a given real interest rate (LM) and Phillip's curve (PC). If this economy is currently
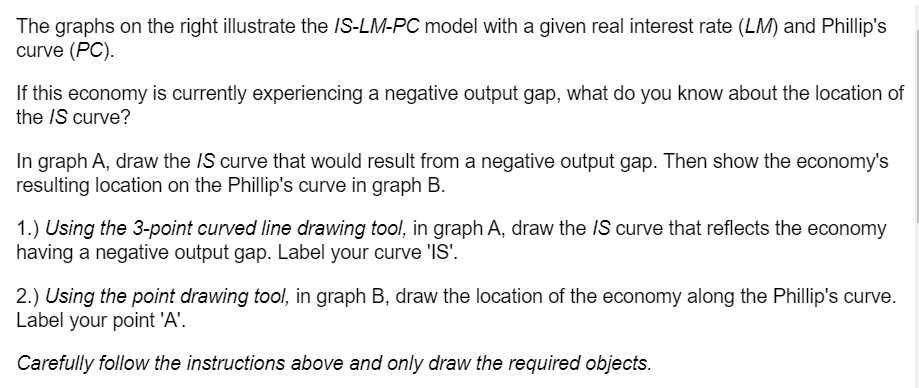
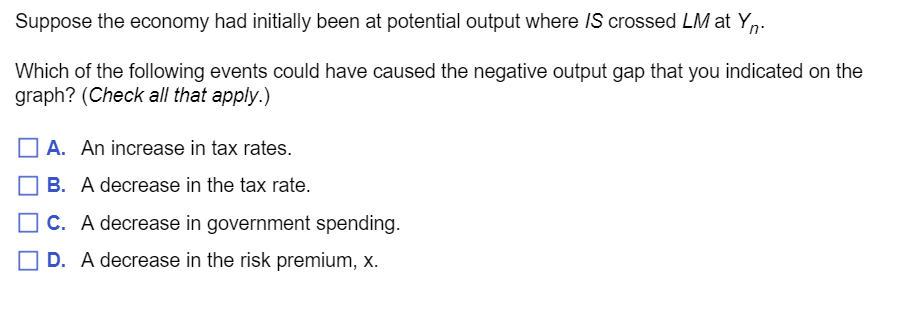
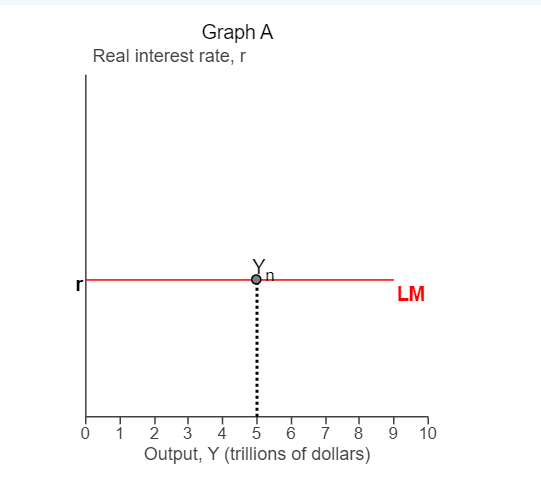
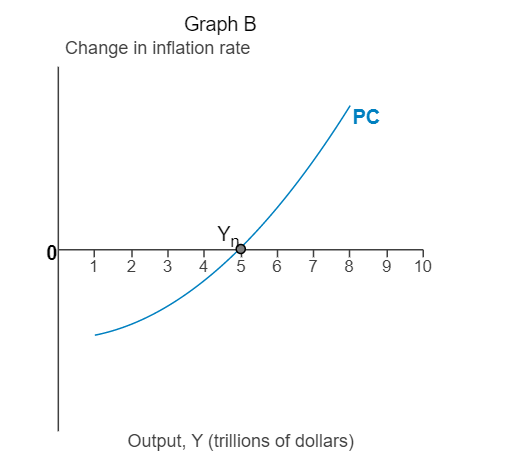
The graphs on the right illustrate the iS-LM-PC model with a given real interest rate (LM) and Phillip's curve (PC). If this economy is currently experiencing a negative output gap, what do you know about the location of the iS curve? In graph A, draw the t8 curve that would result from a negative output gap. Then show the economy's resulting location on the Phillip's curve in graph B. 1.} Using the 3-point curved iine drawing toot, in graph A, draw the is curve that reects the economy having a negative output gap. Label your curve 13'. 2.} Using the point drawing toot, in graph B, draw the location of the economy along the Phillip's curve. Label your point 'A'. Carefutiy totiow the instructions above and onty draw the required objects. Suppose the economy had initially been at potential output where is crossed LM at Y\". Which of the following events could have caused the negative output gap that you indicated on the graph? (Check all that apply.) I] A. An increase in tax rates. |:| B. A decrease in the tax rate. l:l C. A decrease in government spending. |:| D. A decrease in the risk premium, x. Graph A Real interest rate, r LM 0 1 2 3 4 5 7 8 9 10 Output, Y (trillions of dollars)Graph B Change in inflation rate PC V O 1 2 3 4 6 7 8 9 10 Output, Y (trillions of dollars)
Step by Step Solution
There are 3 Steps involved in it

Get step-by-step solutions from verified subject matter experts