

Question: The gure shows data from a 5 year study, and conceptually is similar to Figure 2-3 on page 45 in the textbook. Each line summarizes
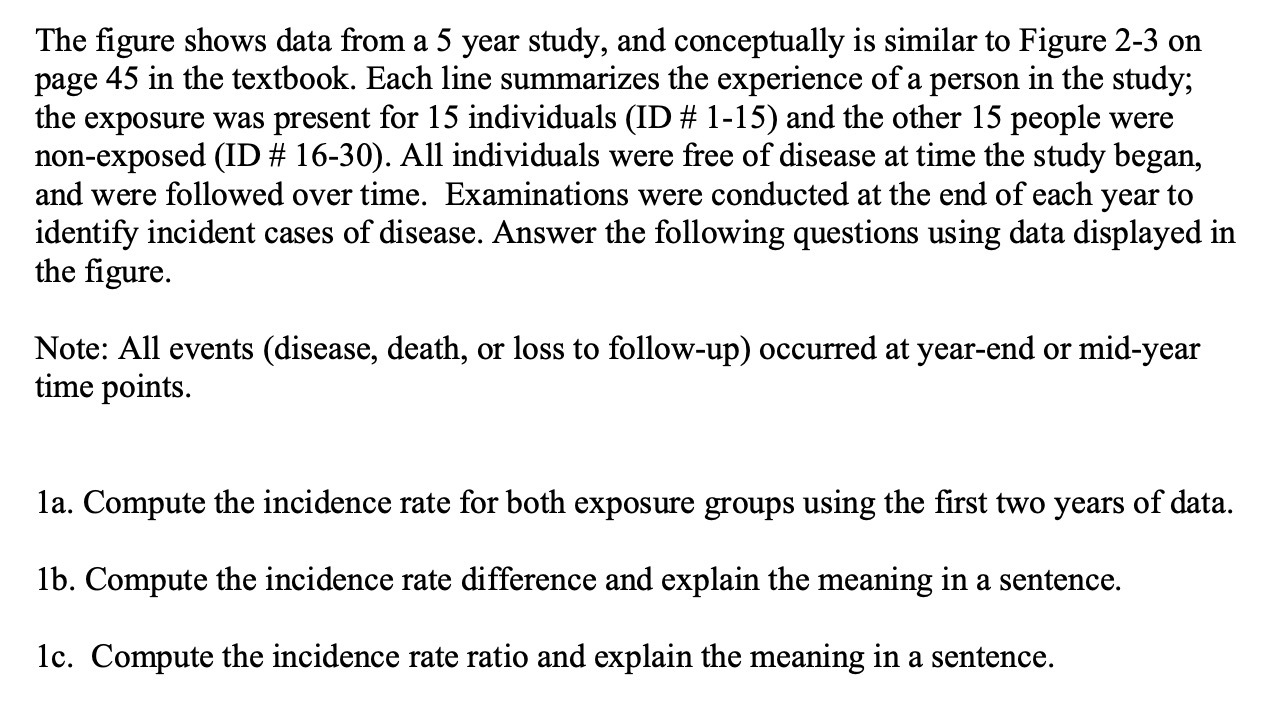
The gure shows data from a 5 year study, and conceptually is similar to Figure 2-3 on page 45 in the textbook. Each line summarizes the experience of a person in the study; the exposure was present for 15 individuals (ID # 1-15) and the other 15 people were non-exposed (ID # 16-30). All individuals were free of disease at time the study began, and were followed over time. Examinations were conducted at the end of each year to identify incident cases of disease. Answer the following questions using data displayed in the gure. Note: All events (disease, death, or loss to follow-up) occurred at year-end or mid-year time points. la. Compute the incidence rate for both exposure groups using the rst two years of data. 1b. Compute the incidence rate difference and explain the meaning in a sentence. 1c. Compute the incidence rate ratio and explain the meaning in a sentence
Step by Step Solution
There are 3 Steps involved in it

Get step-by-step solutions from verified subject matter experts