

Question: The figure on page 3 shows data from a 5 year hypothetical prospective cohort study. Each line summarizes the experience of a person in
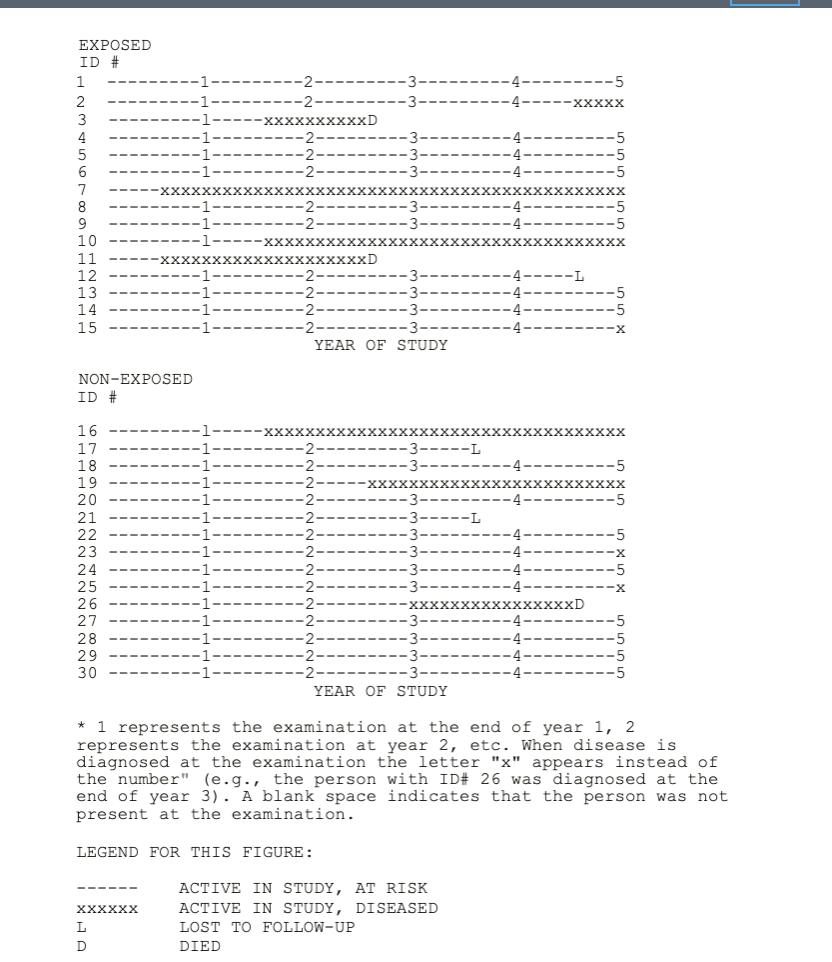
The figure on page 3 shows data from a 5 year hypothetical prospective cohort study. Each line summarizes the experience of a person in the study; the exposure was present for 15 individuals (ID numbers 1-15) and the other 15 people were non- exposed (ID# 16-30). All individuals were free of the disease at baseline, and incident cases of disease were diagnosed at mid- year or at examinations conducted at the end of each year. Answer the following questions using the data displayed in the figure. 1 Based on the data from the first two years of the study, answer the following questions. 1a. Compute and interpret the cumulative incidence of disease separately for the exposed and the non-exposed for the first 2 years of the study (i.e. years 1 and 2 combined). (4 points for calculation and 2 points for interpretation) 1b. Compute the incidence odds (odds of cumulative incidence ) for each exposure group for the first 2 years in the study. Is the incidence odds a good estimate of the cumulative incidence computed in la? (4 points for calculation and 2 points for interpretation) 1c. Compute and interpret the prevalence of disease for each exposure group at the examination at the end of year 2. Briefly discuss why the prevalence measures are similar or different to the incidence measures in la. (4 points for calculation and 2 points for interpretation, 2 points for discussion) 1d. Compute and interpret the incidence rate (density) for each exposure group using the first 2 years of data. (4 points for calculation and 2 points for interpretation) 2. Compute cumulative incidence and incidence rate (density) of disease for each exposure group using the first 3 years of data. Compute the prevalence of disease for each exposure group at the examination at the end of year 3. Briefly discuss the comparison of cumulative incidence and prevalence (as in 1c). (12 points for calculation, 2 points for discussion) 3. Compute cumulative incidence and incidence rate (density) of disease for each exposure group using the first 4 years of data. Compute the prevalence of disease for each exposure group at the examination at the end of year 4. Describe how loss to follow-up affects each of these measures. (12 points for calculation, 2 points for discussion) 4. Compute the incidence rate (density) for each exposure group using all five years of data. (4 points for calculation) 5. Describe the differences between cumulative incidence and incidence rate (density) with respect to their (1) units, (2) ranges, and (3) characteristics of populations for which these measures are appropriate for. (3 points) EXPOSED ID # 2 3 4 6 7 8 9 10 11 12 13 14 15 NON-EXPOSED ID # 16 17 18 19 20 21 22 23 24 25 26 27 28 29 30 XXXXXX XXXXXXXXXXD L D XXXXXXXXXD YEAR OF STUDY YEAR OF STUDY 4- ACTIVE IN STUDY, AT RISK ACTIVE IN STUDY, DISEASED LOST TO FOLLOW-UP DIED XXXXX XXXXXX * 1 represents the examination at the end of year 1, 2 represents the examination at year 2, etc. When disease is diagnosed at the examination the letter "x" appears instead of the number" (e.g., the person with ID# 26 was diagnosed at the end of year 3). A blank space indicates that the person was not present at the examination. LEGEND FOR THIS FIGURE: xxxxD -5 XXX
Step by Step Solution
3.43 Rating (162 Votes )
There are 3 Steps involved in it

Get step-by-step solutions from verified subject matter experts