Answered step by step
Verified Expert Solution
Link Copied!

Question

1 Approved Answer

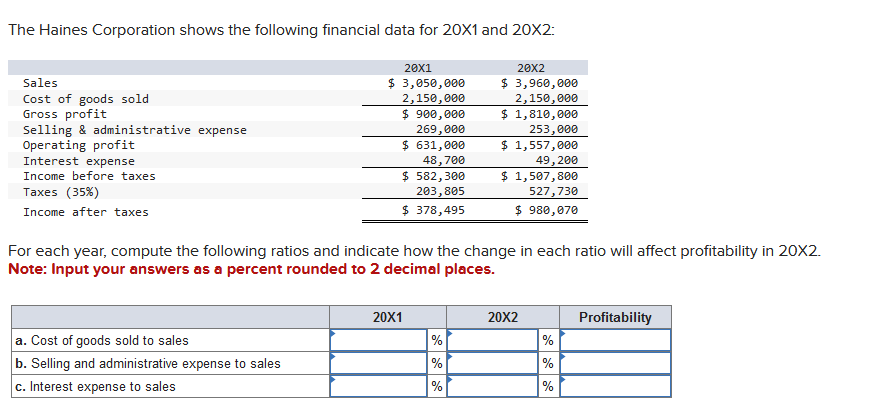
The Haines Corporation shows the following financial data for 20X1 and 20X2: Sales Cost of goods sold Selling & administrative expense Gross profit Operating

image

The Haines Corporation shows the following financial data for 20X1 and 20X2: Sales Cost of goods sold Selling & administrative expense Gross profit Operating profit Interest expense Income before taxes Taxes (35%) Income after taxes 20X1 $ 3,050,000 2,150,000 $ 900,000 269,000 $ 631,000 48,700 $ 582,300 203,805 $ 378,495 20X2 $ 3,960,000 2,150,000 $ 1,810,000 253,000 $ 1,557,000 49,200 $ 1,507,800 527,730 $ 980,070 For each year, compute the following ratios and indicate how the change in each ratio will affect profitability in 20X2. Note: Input your answers as a percent rounded to 2 decimal places. a. Cost of goods sold to sales b. Selling and administrative expense to sales c. Interest expense to sales 20X1 20X2 Profitability % % % % % %

Step by Step Solution

There are 3 Steps involved in it

Step: 1

Sure I can help you solve this problem The image you sent shows the financial data for The Haines Corporation for the years 20X1 and 20X2 Based on this data we can compute the following ratios a Cost ... blur-text-image

Get Instant Access to Expert-Tailored Solutions

See step-by-step solutions with expert insights and AI powered tools for academic success

Step: 2

blur-text-image

Step: 3

blur-text-image

Ace Your Homework with AI

Get the answers you need in no time with our AI-driven, step-by-step assistance

Get Started

Recommended Textbook for

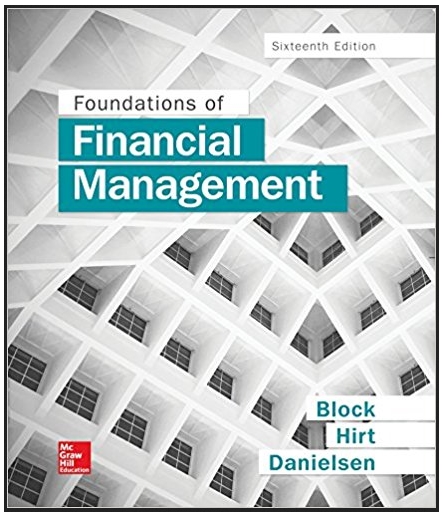
Foundations of Financial Management

Authors: Stanley Block, Geoffrey Hirt, Bartley Danielsen

16th edition

125927716X, 978-1259687969, 1259687961, 978-1259277160

More Books

Students also viewed these Accounting questions