

Question: The Heart and Estrogen Replacement Study was a large scale study designed to examine risk factors for coronary heart disease in a cohort of post-menopausal
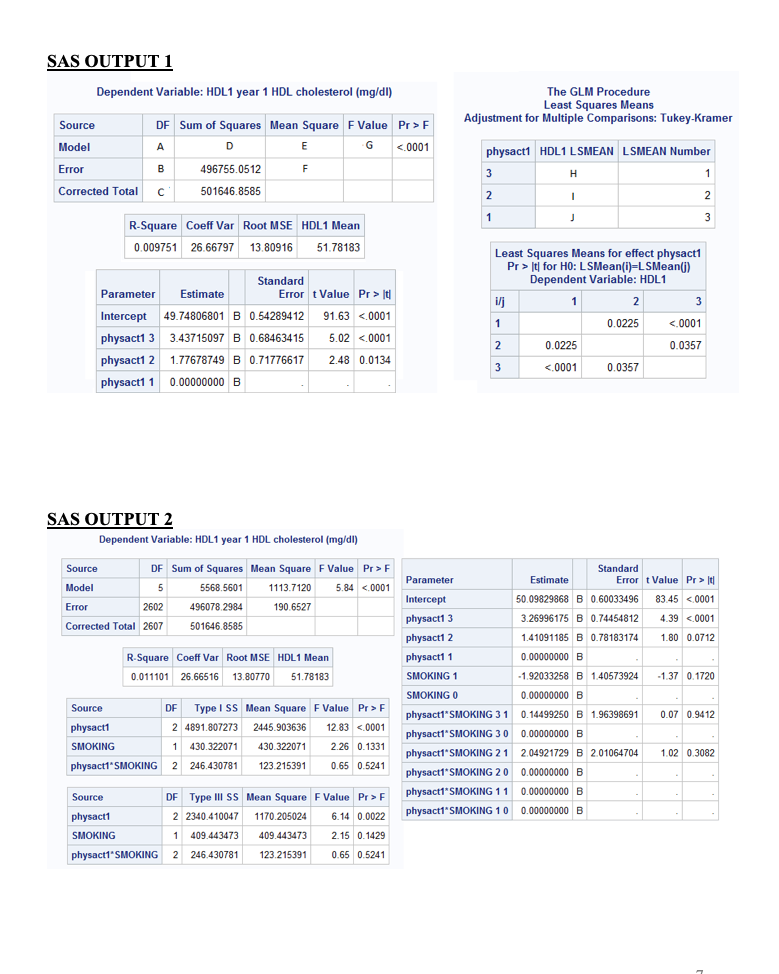
The Heart and Estrogen Replacement Study was a large scale study designed to examine risk factors for coronary heart disease in a cohort of post-menopausal women. The data contains a number of biomarkers such as serum cholesterol and glucose measurements, anthropometric data such as body mass index (BMI) and waist to hip ratio, and behavioral data such as exercise frequency and smoking status. In the examples shown below, SAS output 1-5 represent example analyses from this data on N = 2608 individuals. The outcome variable in all cases is high density lipoprotein (HDL) cholesterol at year 1 of the study. In each analysis below, at least one of the following variables are used as explanatory variables: Physact1 = physical activity level (1=low, 2=moderate, 3=frequent) Smoking = smoking status (1=smoker, 0=nonsmoker) TCHOL = total cholesterol (continuous variable) BMI = body mass index (continuous variable) Exercise = exercise frequency (1=regular, 0=irregular)
For questions 1-6, examine the computer output of the five different models provided for you in the separate packet labeled SAS Output #1-SAS Output #6. Match the output with the most appropriate analysis. You may select each letter (method) more than once, once or not at all.
(1 point each)
1.SASOutput#1a.Independent Samples t-test
2.SASOutput#2b. Two-way ANOVA without aninteraction
3.SASOutput#3c. Two-way ANOVA with aninteraction
4.SASOutput#4d. ANCOVA
5.SASOutput#5e. Multiple Linear Regression
6.SASOutput#6f. One-way ANOVA
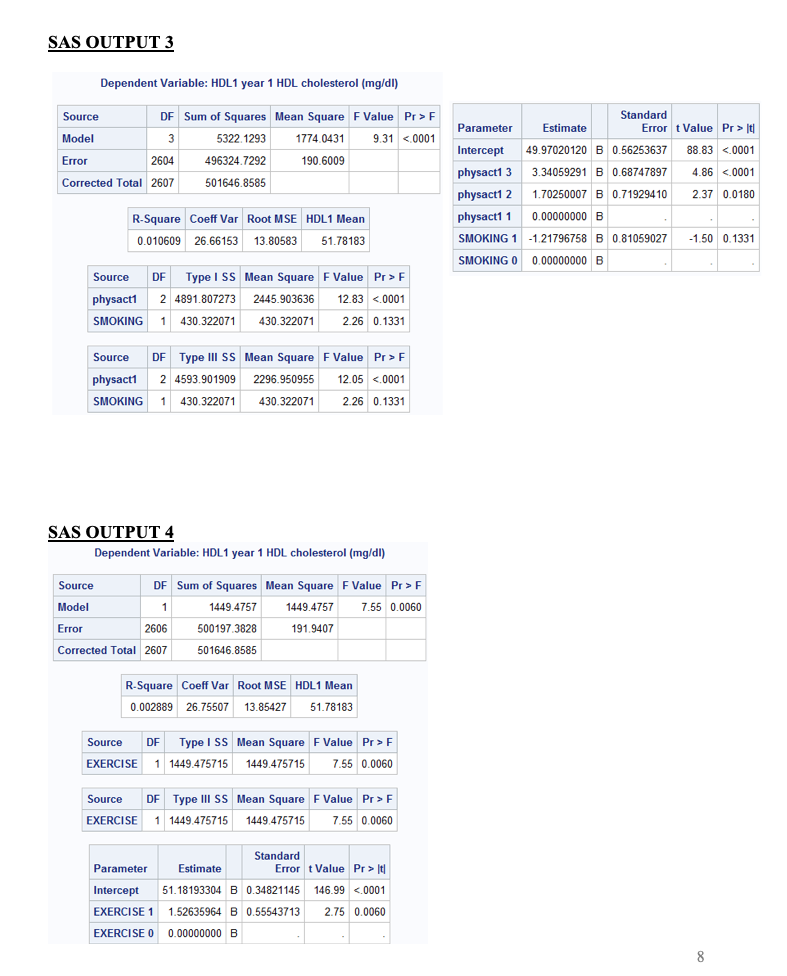
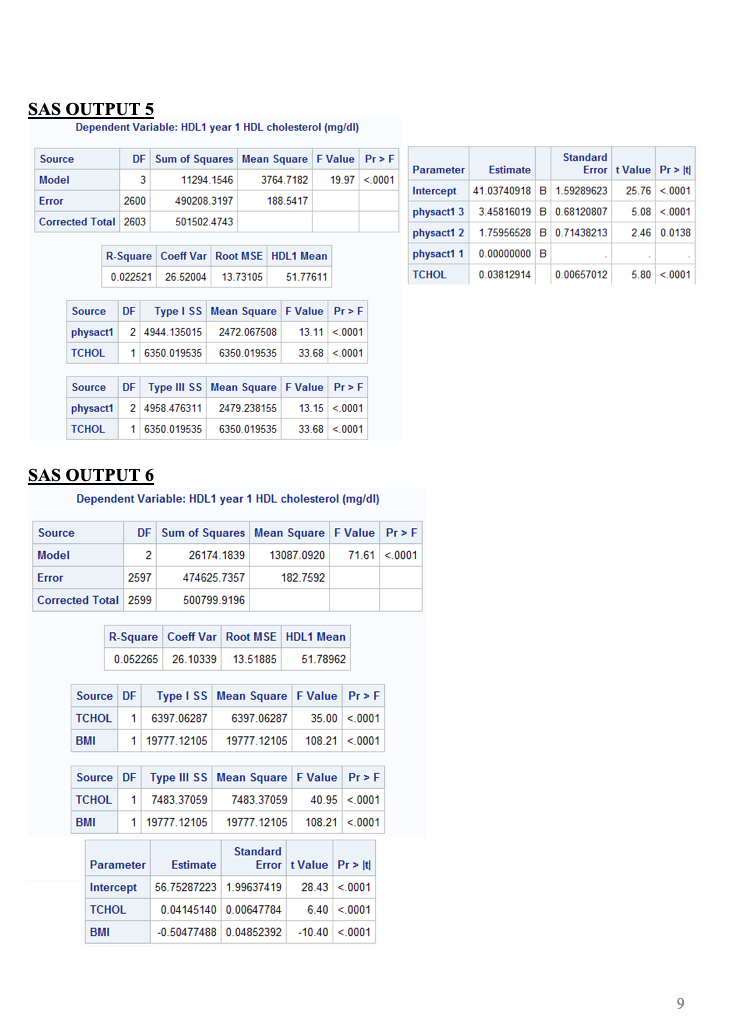
SAS OUTPUT 1 Dependent Variable: HDL1 year 1 HDL cholesterol (mg/dl) The GLM Procedure Least Squares Means Source DF Sum of Squares Mean Square F Value Pr > F Adjustment for Multiple Comparisons: Tukey-Kramer Model A D E G <.0001 physact1 hdl1 lsmean number error f corrected total c in r-square coeff var root mse mean least squares means for effect pr> [t) for HO: LSMean(i)=LSMean(j) Standard Dependent Variable: HDL1 Parameter Estimate Error t Value Pr > It 3 Intercept 49.74806801 8 0.54289412 91.63 1 0.0225 <.0001 physact1 b sas output dependent variable: hdl1 year hdl cholesterol source df sum of squares mean square f value pr> F Standard Model 5568.5601 1113.7120 5.84 <.0001 parameter estimate error t value pr> It Error 2602 496078.2984 190.6527 Intercept 50.09829868 8 0.60033496 83.45 <.0001 corrected total physact1 r-square coeff var root mse hdl1 mean b smoking source df type i ss square f value pr> F 0.07 0.9412 physact1 2 4891.807273 2445.903636 physact1"SMOKING 3 1 0.14499250 B 1.96398691 12.83 <.0001 physact1 b smoking source df type iii ss mean square f value pr> F physact1"SMOKING 1 1 0.00000000 B physact1 2 2340.410047 1170.205024 6.14 0.0022 physact1"SMOKING 1 0 0.00000000 B SMOKING 409.443473 409.443473 2.15 0.1429 physact1" SMOKING 2 246.430781 123.215391 0.65 0.5241SAS OUTPUT 3 Dependent Variable: HDL1 year 1 HDL cholesterol (mg/dl) Source DF Sum of Squares Mean Square F Value Pr > F Standard Model 3 5322. 1293 1774.0431 9.31 <.0001 parameter estimate error t value pr> It 49.97020120 8 0.56253637 88.83 <.0001 error intercept corrected total physact1 b r-square coeff var root mse hdl1 mean smoking source df type i ss square f value pr> F physact1 2 4891.807273 2445.903636 12.83 <.0001 smoking source df type ill ss mean square f value pr> F physact1 2 4593.901909 2296.950955 12.05 <.0001 smoking sas output dependent variable: hdl1 year hdl cholesterol source df sum of squares mean square f value pr> F Model 1449.4757 1449.4757 7.55 0.0060 Error 2606 500197.3828 191.9407 Corrected Total 2607 501646.8585 R-Square Coeff Var Root MSE HDL1 Mean 0.002889 26.75507 13.85427 51.78183 Source DF Type I SS Mean Square F Value Pr > F EXERCISE 1 1449.475715 1449.475715 7.55 0.0060 Source DF Type III SS Mean Square F Value Pr > F EXERCISE 1 1449.475715 1449.475715 7.55 0.0060 Standard Parameter Estimate Error t Value Pr > It] Intercept 51 18193304 B 0.34821145 146.99 <.0001 exercise b output dependent variable: hdl1 year hdl cholesterol source df sum of squares mean square f value pr> F Standard Model 3 11294.1546 3764.7182 19.97 <.0001 parameter estimate error t value pr> It 2600 Intercept 41 03740918 8 1.59289623 Error 490208.3197 188.5417 25.76 <.0001 corrected total physact1 r-square coeff var root mse hdl1 mean b tchol source df type i ss square f value pr> F physact1 2 4944. 135015 2472.067508 13.11 <.0001 tchol source df type iii ss mean square f value pr> F physact1 2 4958.476311 2479.238155 13.15 <.0001 tchol sas output dependent variable: hdl1 year hdl cholesterol source df sum of squares mean square f value pr> F Model 2 26174.1839 13087.0920 71.61 <.0001 error corrected total r-square coeff var root mse hdl1 mean source df type i ss square f value pr> F TCHOL 1 6397.06287 6397.06287 35.00 <.0001 bmi source df type ill ss mean square f value pr> F TCHOL 1 7483.37059 7483.37059 40.95 <.0001 bmi standard parameter estimate error t value pr> It Intercept 56.75287223 1.99637419 28.43 <.0001 tchol bmi>
Step by Step Solution
There are 3 Steps involved in it

Get step-by-step solutions from verified subject matter experts