

Question: The heatmap function will generate the heatmap image. The function has two parameters: a 3 D matrix representing the RGB image of the dome area
The heatmap function will generate the heatmap image. The function has two parameters: a D matrix representing the RGB image of the
dome area and a D matrix of radiation values. The function returns the heatmap as a D matrix that represents an RGB image.
Review: Working with Images
A dimensional matrix represents images. The rows and columns correspond to the pixels in the image ie the rows and columns
The third dimension represents the different "channels" of the image ie redgreenblue or huesaturationvalue
Because we would like to manipulate the color of the image without changing anything else, the HSV image representation see above is
quite convenient. Before working with the image, you should first convert it to HSV using the rgbhsv function.
Once the image is in HSV format, we can consider each channel separately:
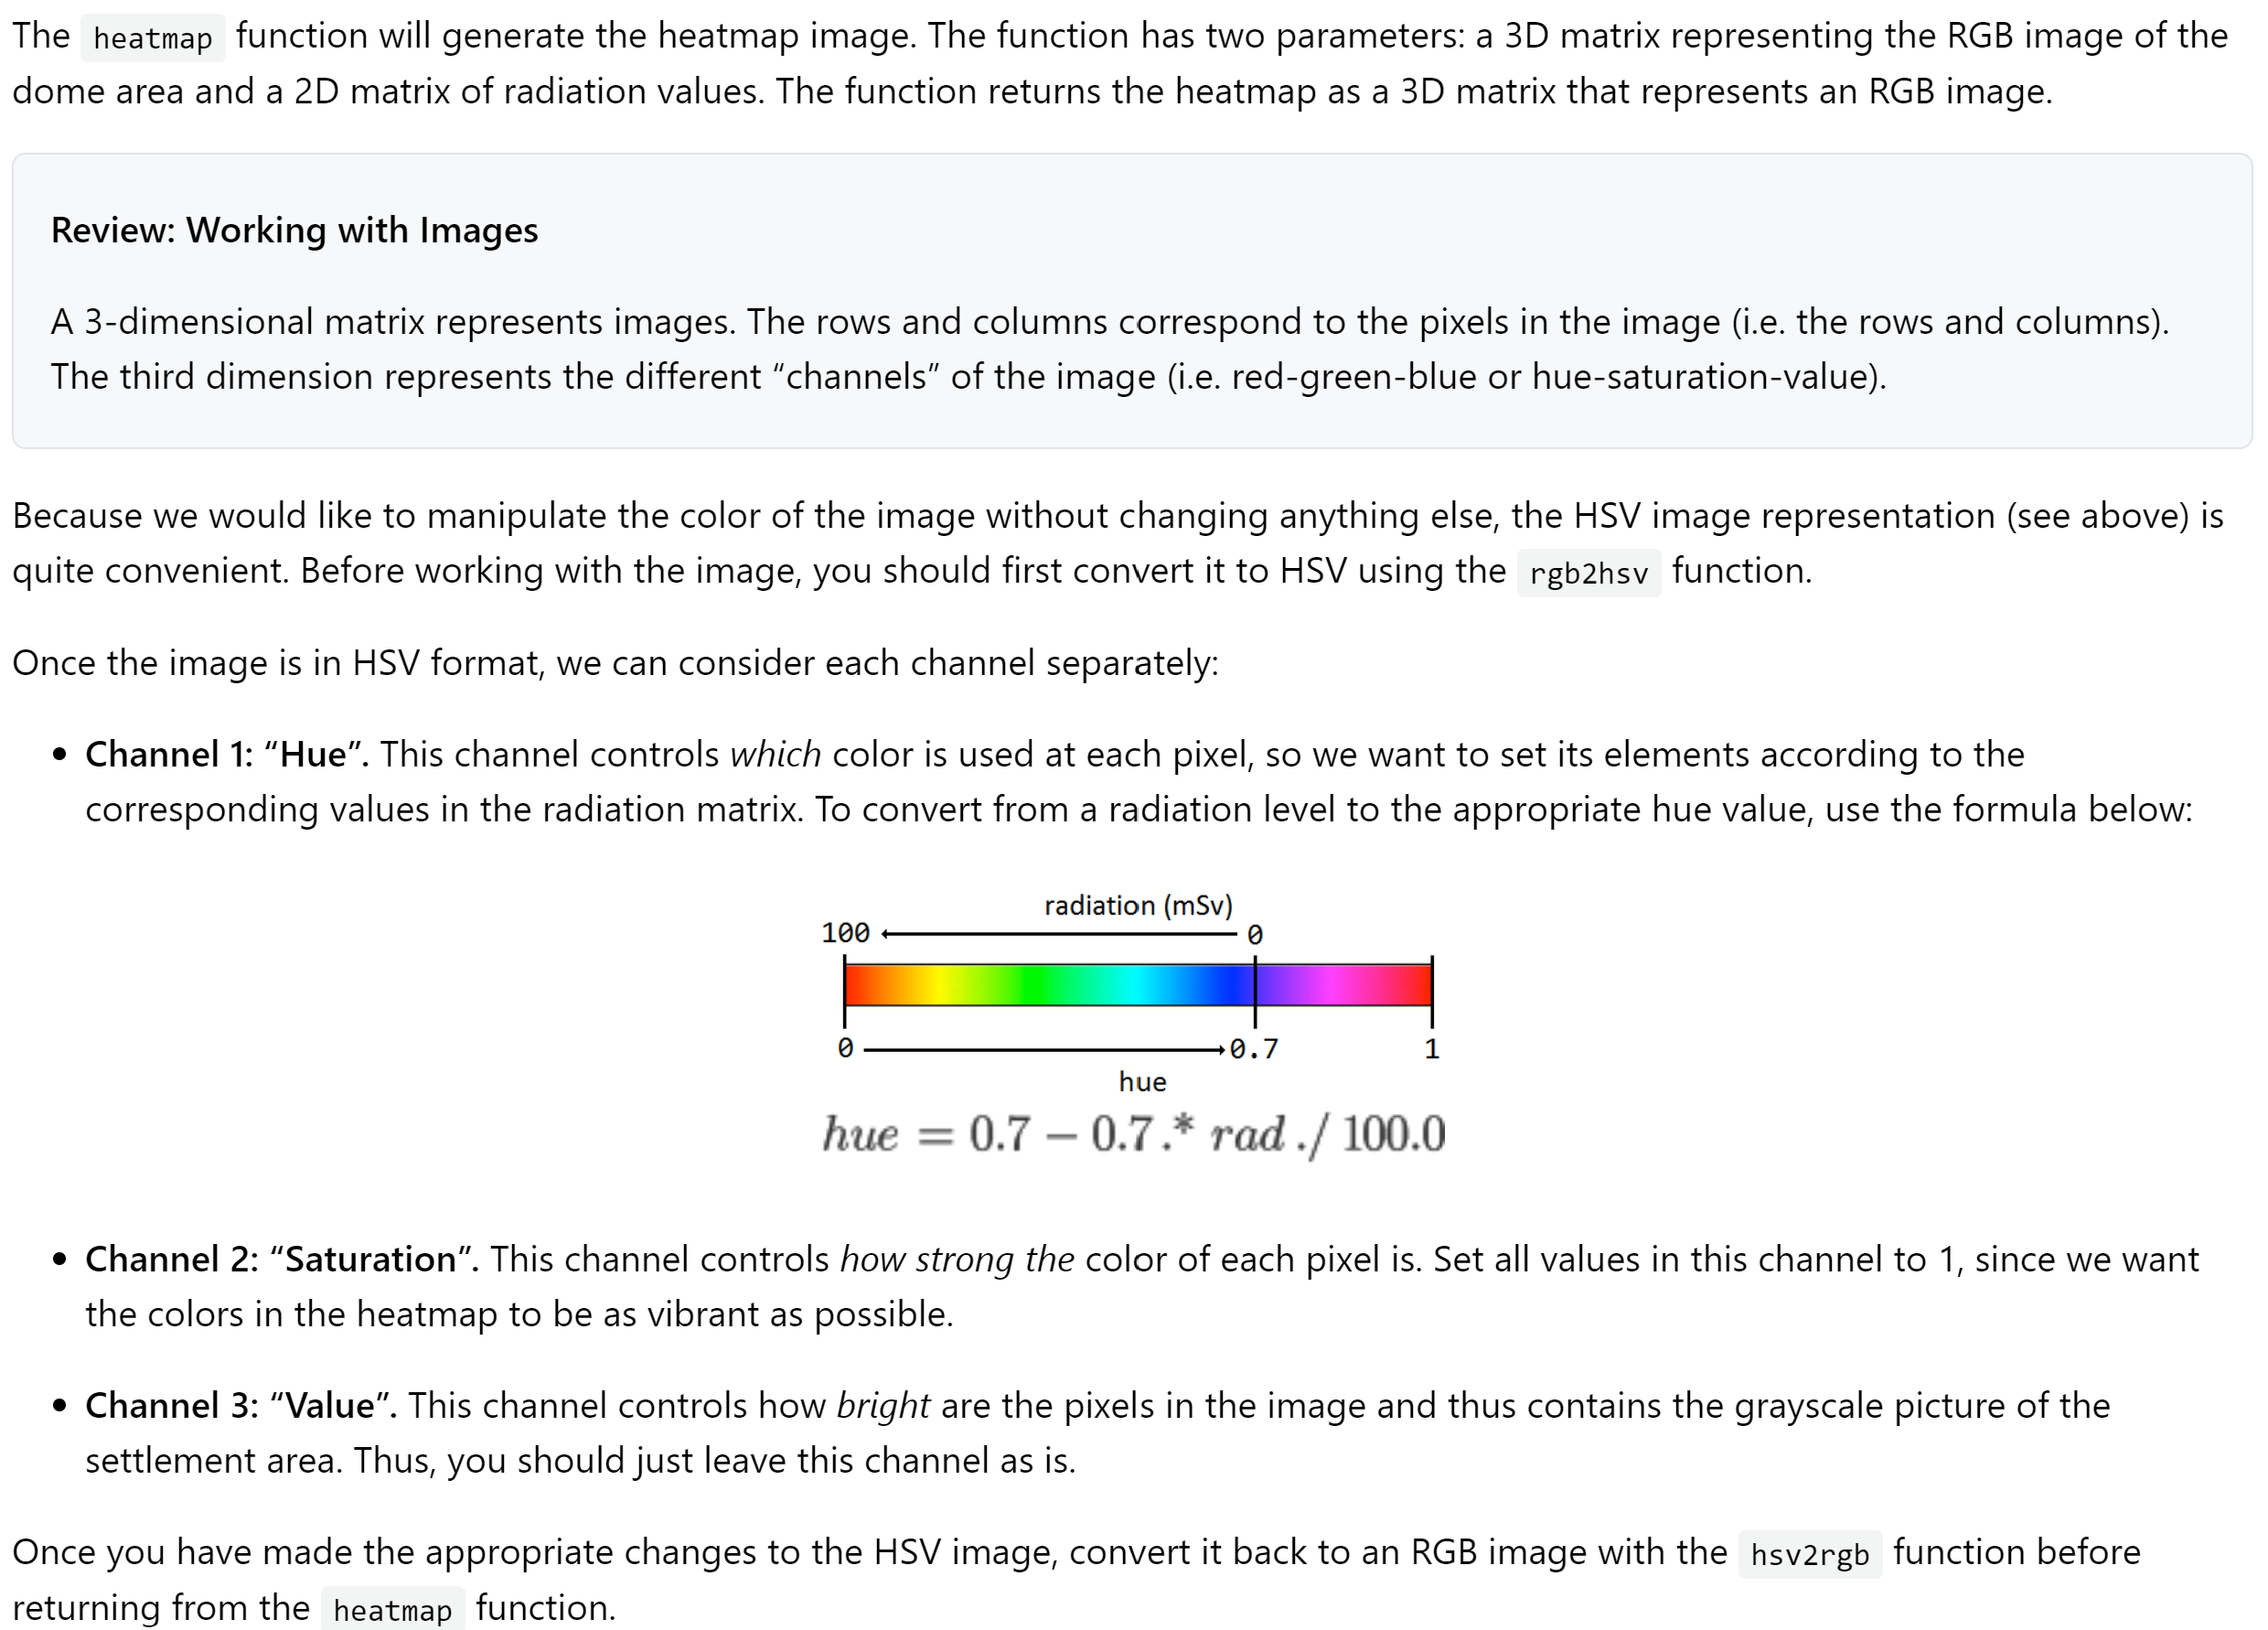
Channel : "Hue". This channel controls which color is used at each pixel, so we want to set its elements according to the
corresponding values in the radiation matrix. To convert from a radiation level to the appropriate hue value, use the formula below:
Channel : "Saturation". This channel controls how strong the color of each pixel is Set all values in this channel to since we want
the colors in the heatmap to be as vibrant as possible.
Channel : "Value". This channel controls how bright are the pixels in the image and thus contains the grayscale picture of the
settlement area. Thus, you should just leave this channel as is
Once you have made the appropriate changes to the HSV image, convert it back to an RGB image with the hsvrgb function before
returning from the heatmap function. Function definition and description
The function header and comments are provided for you in the file called heatmapstarter.m Don't forget to remove
from the
filename before you try to call this function.
function img heatmap img, rad
Generates a heatmap image by using values
from rad to set values in the hue channel for img.
Hue values vary smoothly depending on the
corresponding radiation level.
img: a dimensional matrix of numbers representing
an image in RGB redgreenblue format, which
forms the background to which the heatmap
colors are applied.
rad: a matrix of numbers representing the radiation
measurements, between and millisieverts
It has the same width and height as the img
parameter.
Testing your heatmap function
To test your heatmap function, first read the dome picture into MATLAB by typing this into the Command Window:
img imreaddomearea.jpg;
Then get a set of radiation data:
rad adiation ;
Next, call your removeNoise function and save the smoothed data back into rad:
rad removeNoiserad; imshowheatmapimg rad;
If your removeNoise function and
functions are working correctly, you should see a picture that looks like this:
This test case is also available in the
file. You can add test cases to this file to continue testing your
function.
You can also quickly test your functions using different radiation scans by typing this into the Command Window:
imshowheatmapimg removeNoisescanradiation;
Which should result in this picture:
This method of testing the functions is exactly the same as the stepbystep method outlined above, it just puts all of the steps into one
statement. Use whichever method is the most helpful to you!
Step by Step Solution
There are 3 Steps involved in it
1 Expert Approved Answer
Step: 1 Unlock

Question Has Been Solved by an Expert!
Get step-by-step solutions from verified subject matter experts
Step: 2 Unlock
Step: 3 Unlock