

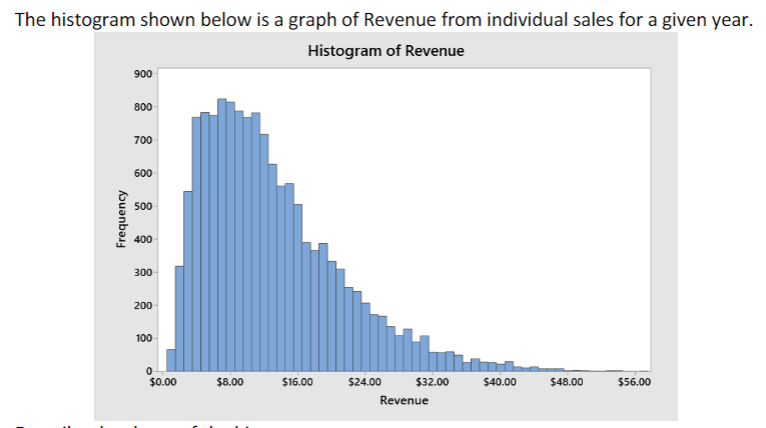
The histogram shown below is a graph of Revenue from individual sales for a given year....
Fantastic news! We've Found the answer you've been seeking!
Question:
Expert Answer:

Posted Date:
