

The histogram to the right shows the distribution of the prices of plain pizza slices (in $)
Fantastic news! We've Found the answer you've been seeking!
Question:
The histogram to the right shows the distribution of the prices of plain pizza slices (in $) for 151 weeks in a large city. Which summary statistics would you choose to summarize the center and spread in these data? Why?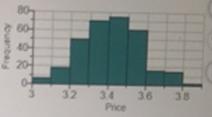
Expert Answer:

Related Book For 

Statistics for Business and Economics
ISBN: 978-0132930192
8th edition
Authors: Paul Newbold, William Carlson, Betty Thorne
Posted Date:
