

Question: The horizontal axis is labeled quantity. The vertical axis is labeled price. The vertical axis ranges from 0 to 50 dollars in increments of 5
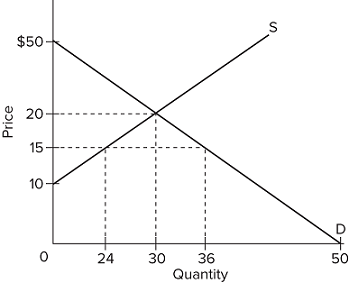 The horizontal axis is labeled quantity. The vertical axis is labeled price. The vertical axis ranges from 0 to 50 dollars in increments of 5 dollars. The horizontal axis ranges form 0 to 50 in increments of 6. A rising line labeled S and a falling line labeled D are plotted. Both lines intersect at a point where quantity is 30 and price is 20. Points on the S and D lines for a price of 15 dollars correspond to quantities 24 and 36 respectively.
Consider the supply and demand curves depicted in the diagram above. If the government imposed a price ceiling of $15, then buyers will be intending to buy _________blank, but they will be able to legally buy _________blank.
Price $50 20 15 10 0 24 30 36 Quantity S D + 50
Step by Step Solution
3.28 Rating (163 Votes )
There are 3 Steps involved in it
The detailed answer for the above question is prov... View full answer

Get step-by-step solutions from verified subject matter experts