

Below in Figure P18-11b are two COMSOL simulations for a laminar-flow reactor with heat effects: Run 1
Question:
Below in Figure P18-11b are two COMSOL simulations for a laminar-flow reactor with heat effects: Run 1 and Run 2. The following figures show the cross section plot of concentration for species A at the middle of the reactor. Run 2 shows a minimum on the cross-section plot. This minimum could be the result of (circle all that apply and explain your reasoning for each suggestion (a) through (e)).
a. The thermal conductivity of reaction mixture decreases
b. Overall heat transfer coefficient increases
c. Overall heat transfer coefficient decreases
d. The coolant flow rate increases
e. The coolant flow rate decreases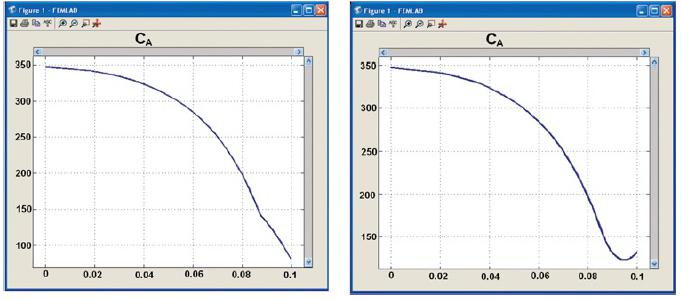
The two COMSOL screenshots show the graphs of C subscript A. The horizontal axis ranges from 0 to 0.1, in increments of 0.02. The vertical axis ranges from 150 to 350 in increments of 50. The first figure shows a concave downward and decreasing curve, such that the concentration decreases from 350 to 50, as the value on the horizontal axis increases from 0 to 0.1. The second figure shows that the concentration decreases from 350 to 50, as the value on the horizontal axis increases from 0 to 0.09, after which the concentration increases to 100 at 0.1.
Step by Step Answer:
Link for accessing COMSOL and COMSOL tutorials httpwwwumicheduelements6ecomso...View the full answer


