

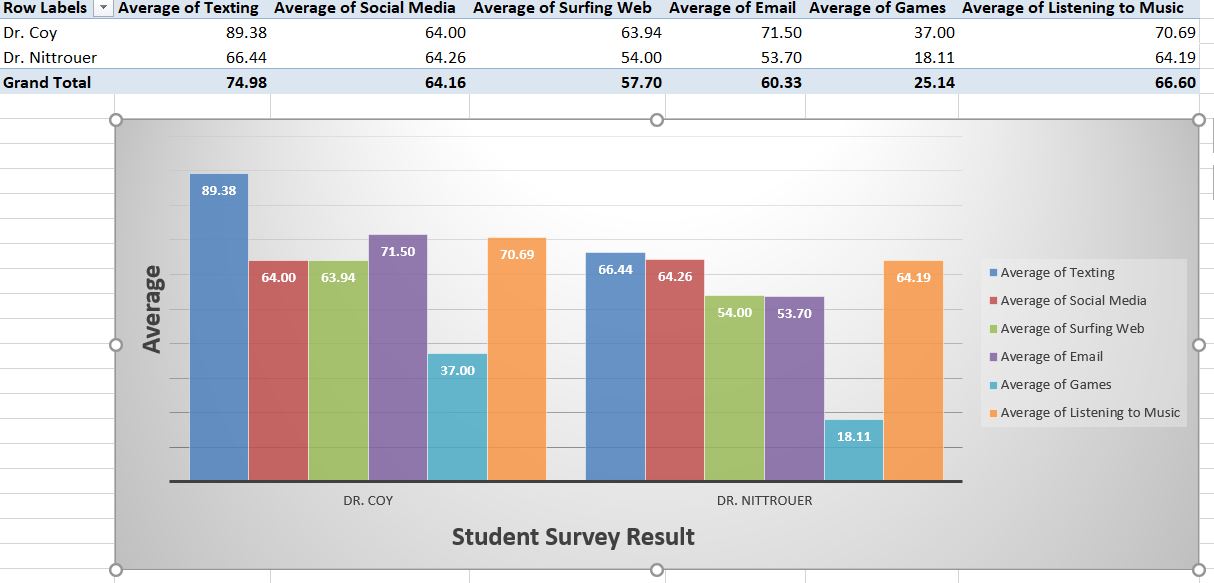
Question: The image below is the accurate and complete pivot chart I created. The pivot chart illustrates the differences between the two class survey sections. Kindly,
The image below is the accurate and complete pivot chart I created. The pivot chart illustrates the differences between the two class survey sections. Kindly, it is NOT missing any information. Based on the picture I have presented, All I Need To Know Is, what are the similarities and differences between the two sections?
Can someone help me please without saying that "more information is needed?"
\f
Step by Step Solution
There are 3 Steps involved in it
1 Expert Approved Answer
Step: 1 Unlock

Question Has Been Solved by an Expert!
Get step-by-step solutions from verified subject matter experts
Step: 2 Unlock
Step: 3 Unlock