

Question: the info is sufficient I would post it again for clarity For this question, round to 1 decimal place and report only the number... you
the info is sufficient I would post it again for clarity
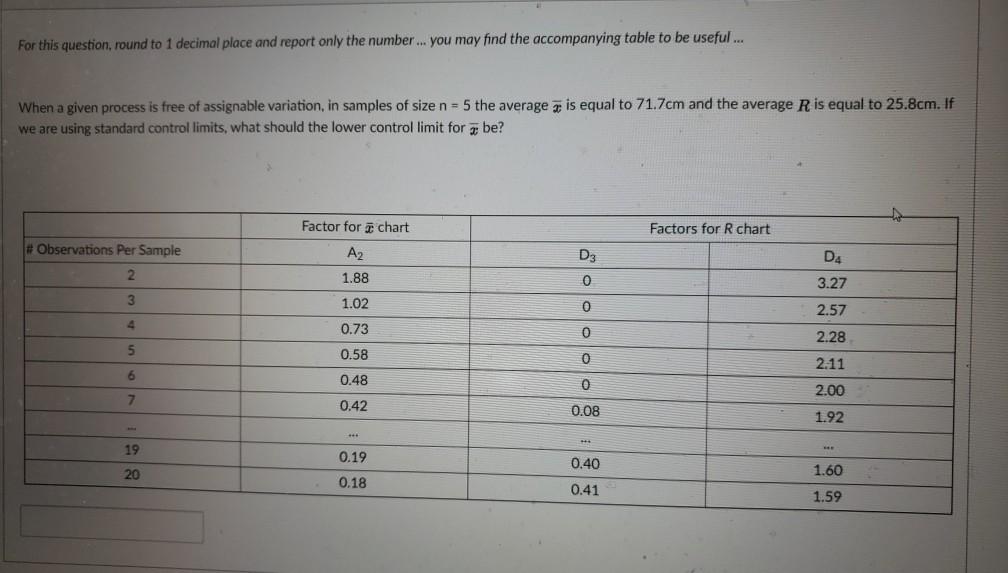
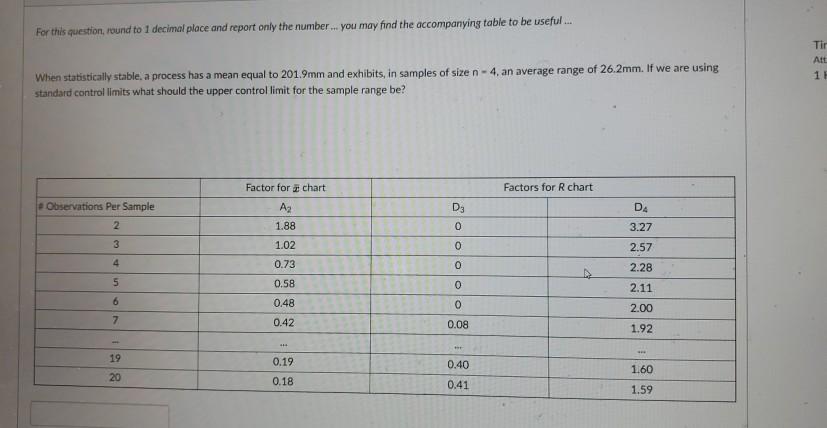
For this question, round to 1 decimal place and report only the number... you may find the accompanying table to be useful... Tir 1 When statistically stable, a process has a mean equal to 201.9mm and exhibits, in samples of size n-4 an average range of 26.2mm. If we are using standard control limits what should the upper controllimit for the sample range be? Factors for R chart Factor for chart Az 1.88 Observations Per Sample 2 DA OOO 3.27 3 1.02 2.57 4 0.73 0 2.28 5 0.58 0 2.11 6 0.48 0 2.00 7 0.42 0.08 1.92 19 0.19 0.40 20 0.18 0.41 1.60 1.59 For this question, round to 1 decimal place and report only the number... you may find the accompanying table to be useful... When a given process is free of assignable variation, in samples of size n = 5 the average z is equal to 71.7cm and the average R is equal to 25.8cm. If we are using standard control limits, what should the lower control limit for be? Factor for chart Factors for R chart # Observations Per Sample A2 1.88 D4 D3 0 2 3.27 3 1.02 0 2.57 4 0.73 0 2.28 5 0.58 0 6 0.48 2.11 2.00 0 7 0.42 0.08 1.92 19 0.19 0.18 0.40 20 1.60 0.41 1.59
Step by Step Solution
There are 3 Steps involved in it
1 Expert Approved Answer
Step: 1 Unlock

Question Has Been Solved by an Expert!
Get step-by-step solutions from verified subject matter experts
Step: 2 Unlock
Step: 3 Unlock