

Question: the info you need plz answer as soon as possible Download Case Study B, complete the financial model for Company XYZ, and answer the following
 the info you need
plz answer as soon as possible
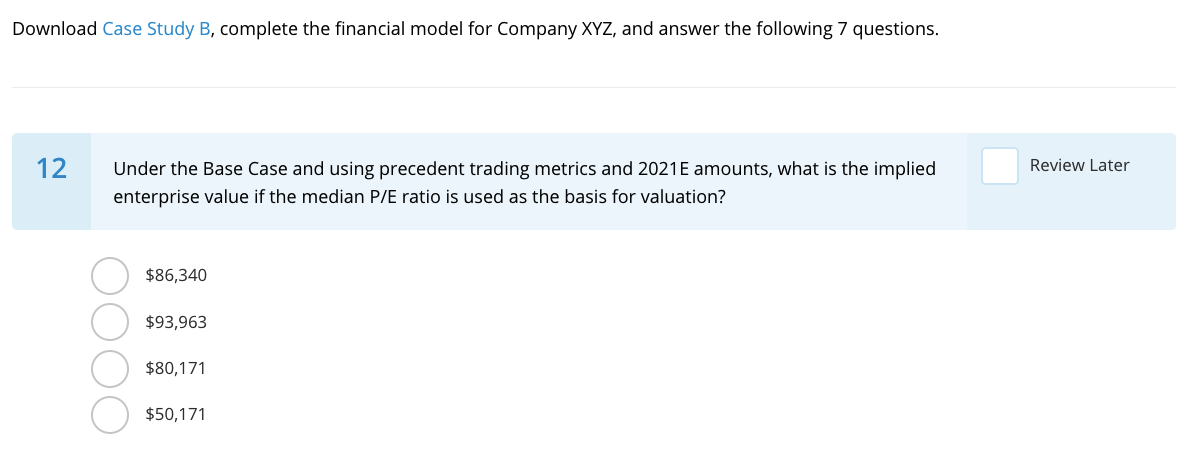
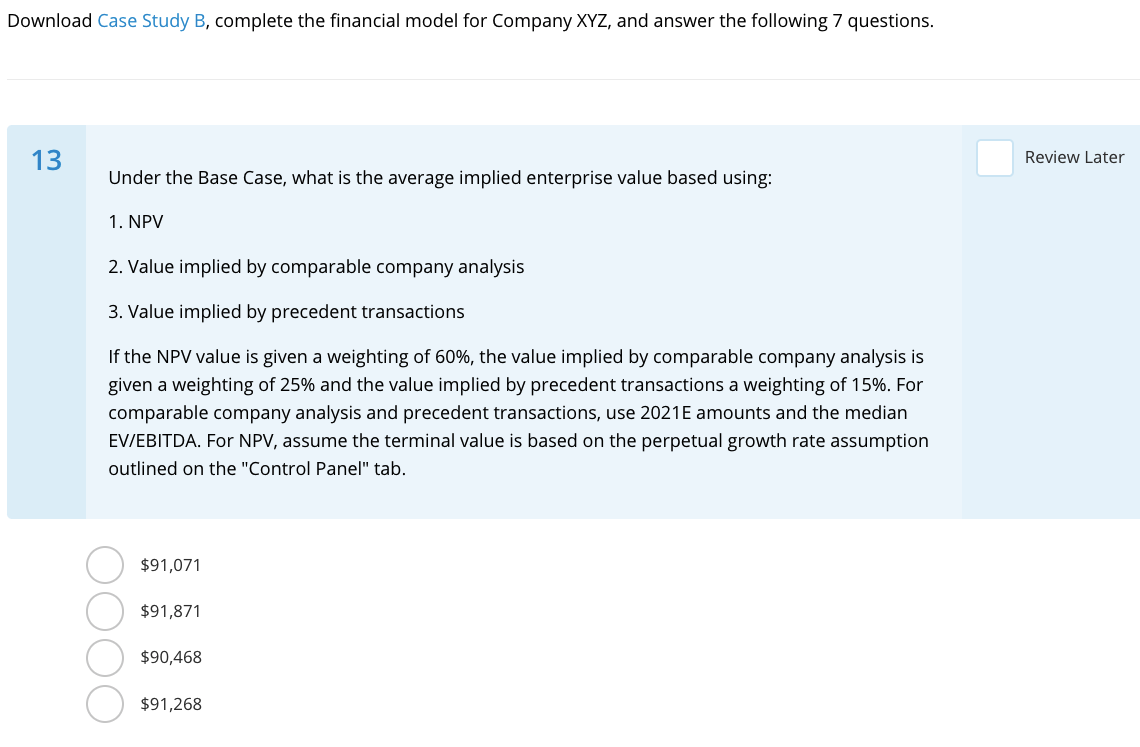
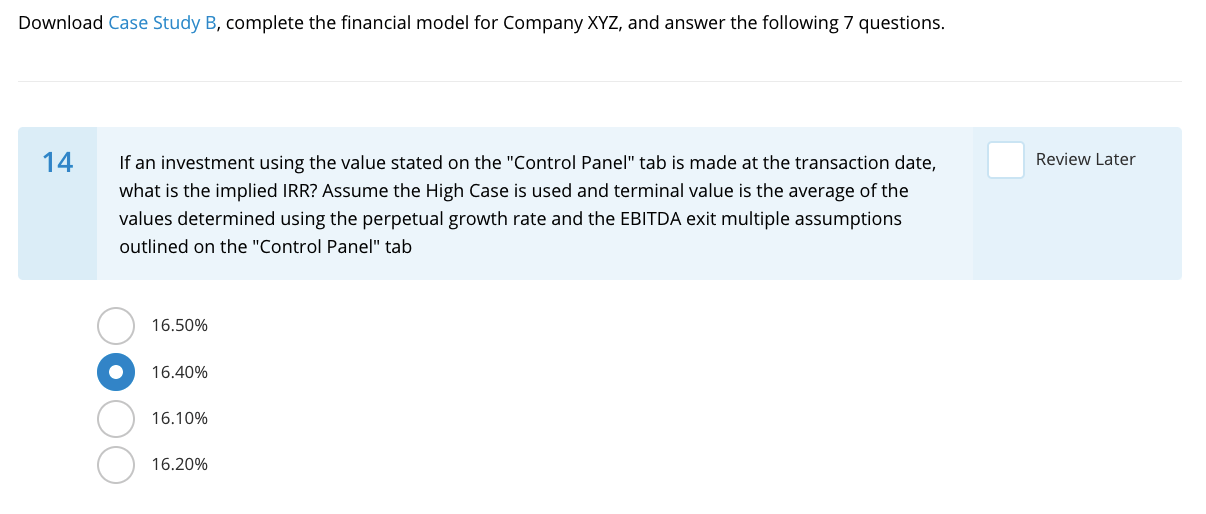
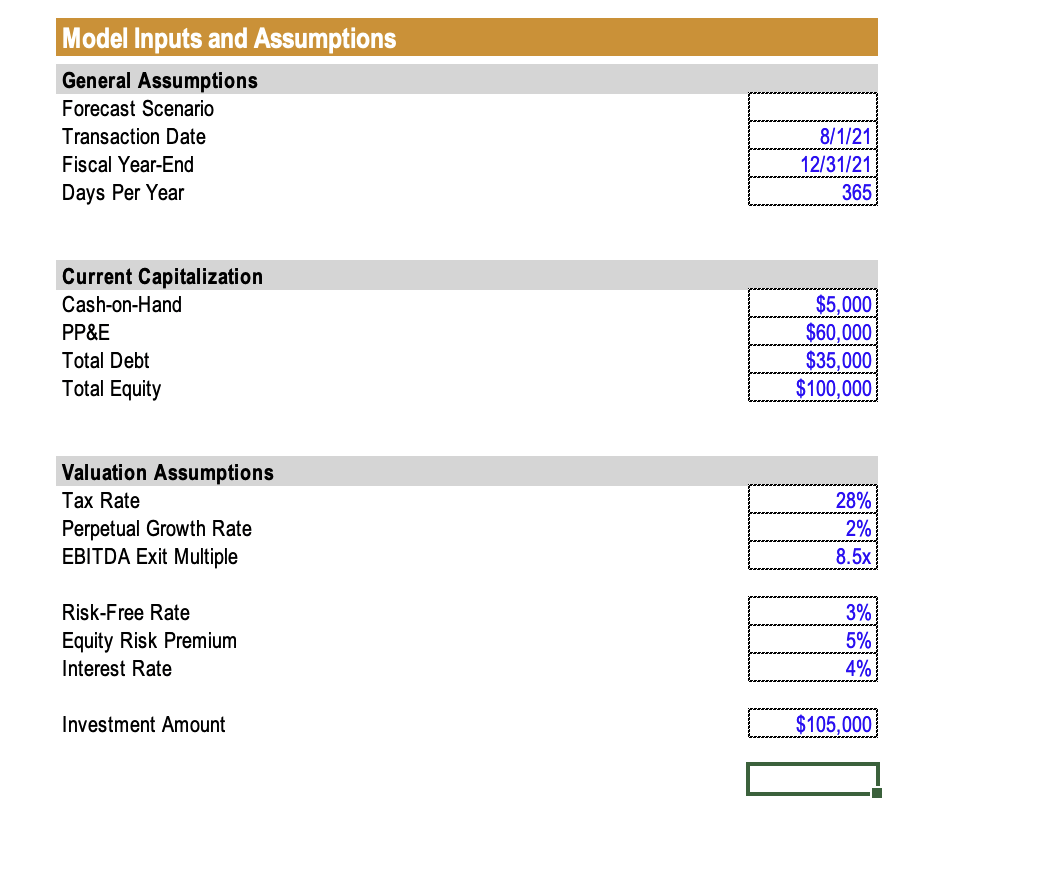
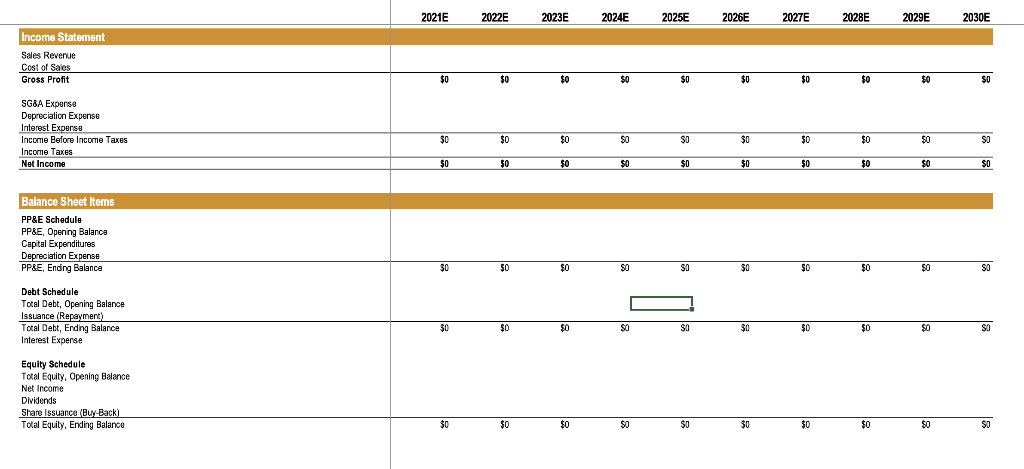
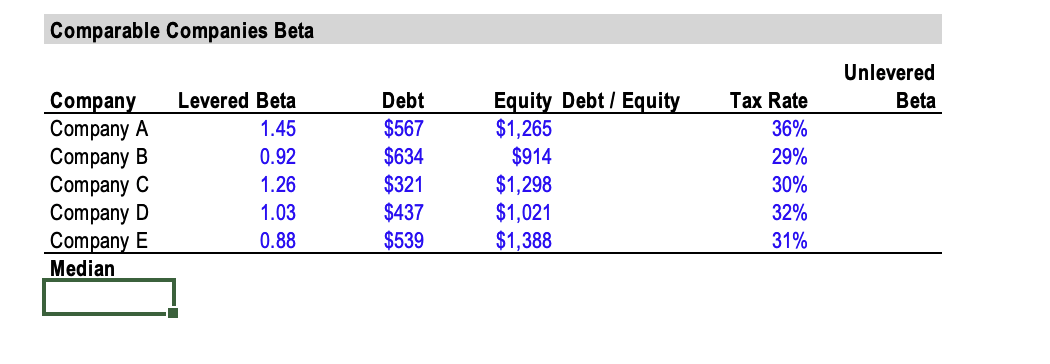
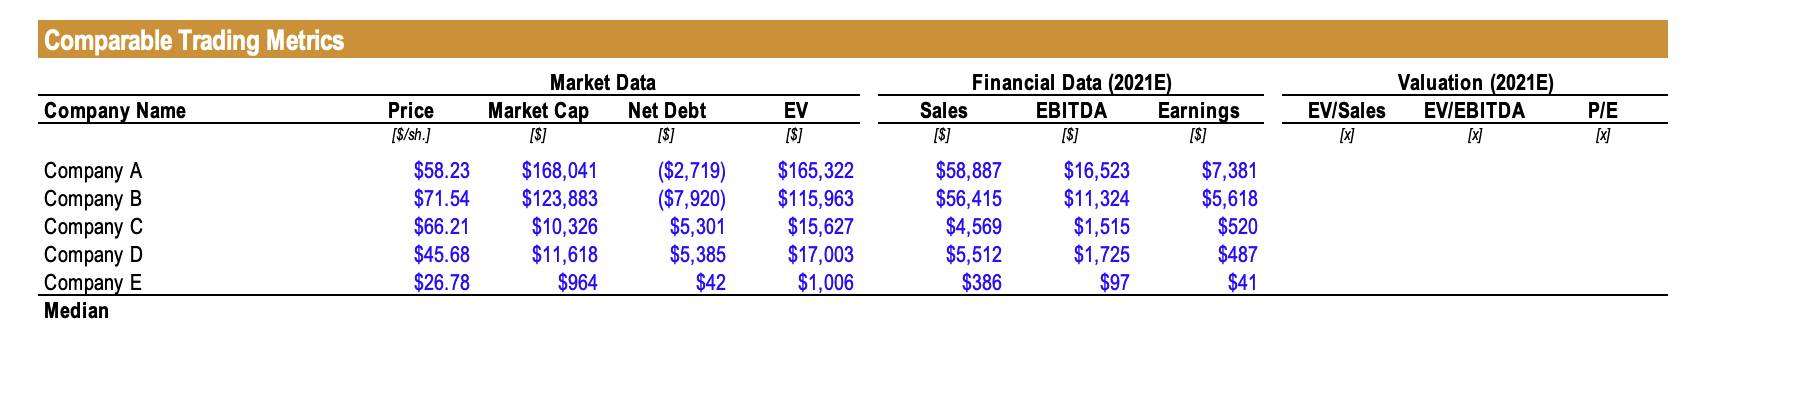
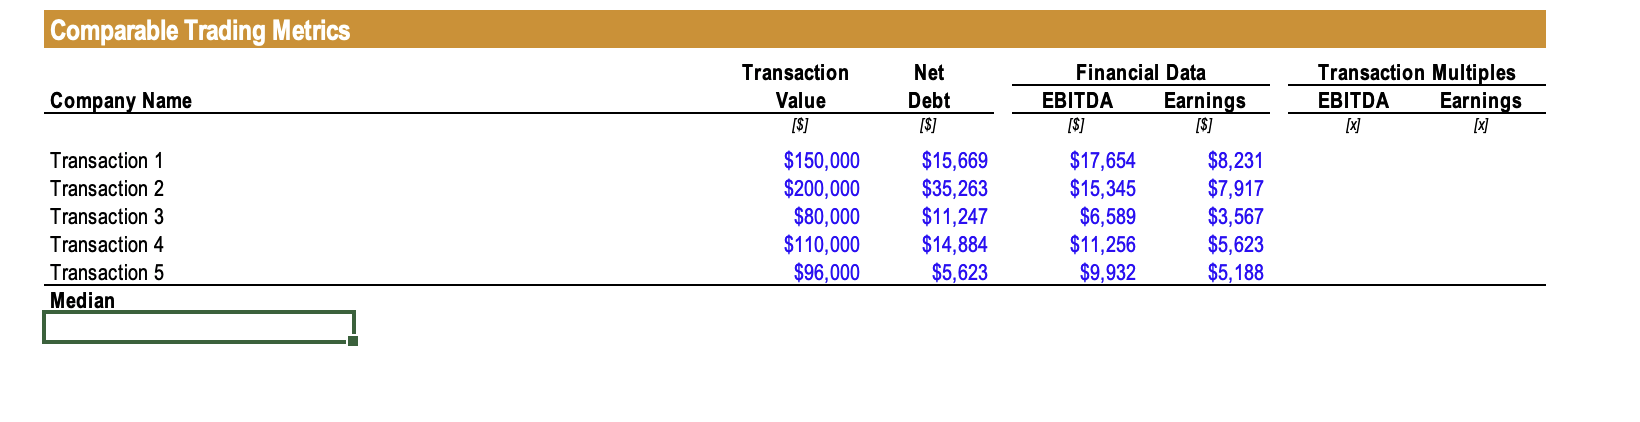
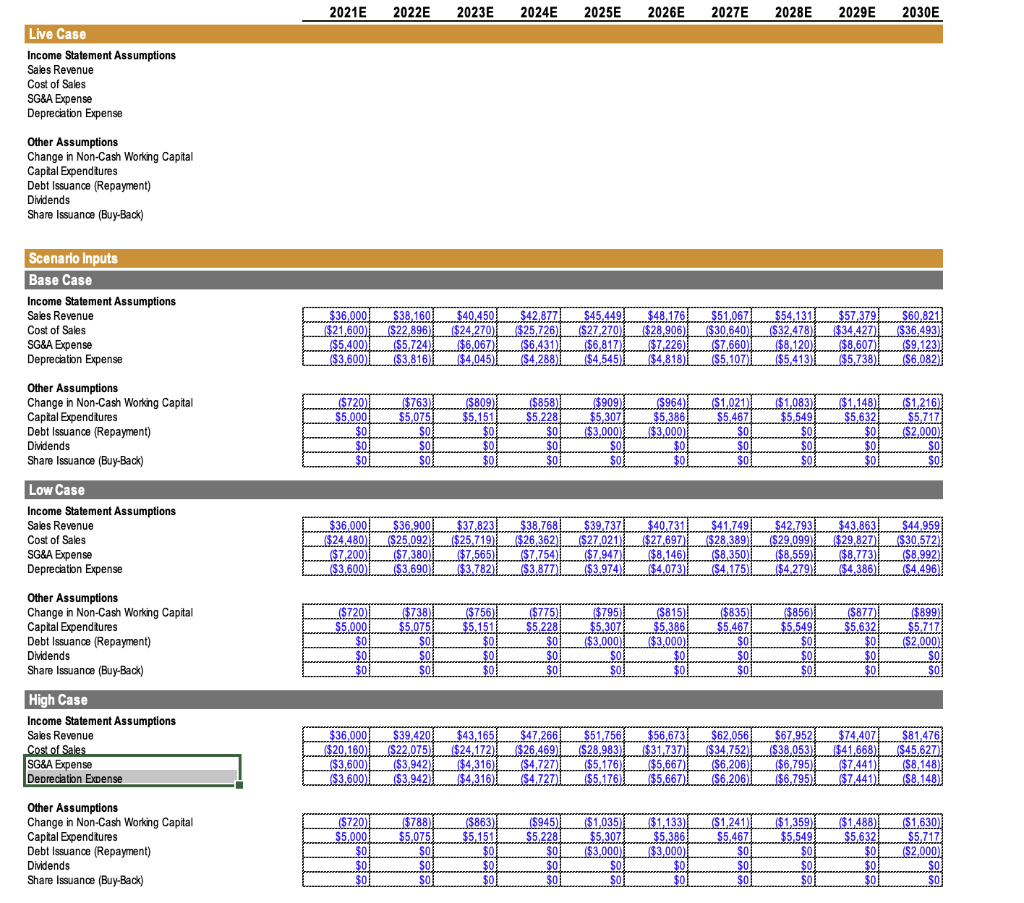
Download Case Study B, complete the financial model for Company XYZ, and answer the following 7 questions. 12 Review Later Under the Base Case and using precedent trading metrics and 2021E amounts, what is the implied enterprise value if the median P/E ratio is used as the basis for valuation? $86,340 $93,963 $80,171 $50,171 Download Case Study B, complete the financial model for Company XYZ, and answer the following 7 questions. 13 Review Later Under the Base Case, what is the average implied enterprise value based using: 1. NPV 2. Value implied by comparable company analysis 3. Value implied by precedent transactions If the NPV value is given a weighting of 60%, the value implied by comparable company analysis is given a weighting of 25% and the value implied by precedent transactions a weighting of 15%. For comparable company analysis and precedent transactions, use 2021E amounts and the median EV/EBITDA. For NPV, assume the terminal value is based on the perpetual growth rate assumption outlined on the "Control Panel" tab. $91,071 $91,871 $90,468 $91,268 Download Case Study B, complete the financial model for Company XYZ, and answer the following 7 questions. 14 Review Later If an investment using the value stated on the "Control Panel" tab is made at the transaction date, what is the implied IRR? Assume the High Case is used and terminal value is the average of the values determined using the perpetual growth rate and the EBITDA exit multiple assumptions outlined on the "Control Panel" tab 16.50% 16.40% 16.10% 16.20% Model Inputs and Assumptions General Assumptions Forecast Scenario Transaction Date Fiscal Year-End Days Per Year 8/1/21 12/31/21 365 Current Capitalization Cash-on-Hand PP&E Total Debt Total Equity $5,000 $60,000 $35,000 $100,000 Valuation Assumptions Tax Rate Perpetual Growth Rate EBITDA Exit Multiple 28% 2% 8.5x Risk-Free Rate Equity Risk Premium Interest Rate 3% 5% 4% Investment Amount $105,000 2021E 2022E 2023E 2024E 2025E 2026E 2027E 2028E 2029E 2030E Income Statement Sales Revenue Cost of Sales Gross Profit $0 $0 $0 $0 $0 $0 $0 $0 $0 $0 SG&A Expense Depreciation Expense Interest Expense Income Before Income Taxes Income Taxes Net Income $0 $0 $0 so SO $0 $0 $0 $0 SO $0 $0 $0 $0 $0 $0 $0 $0 $0 $0 Balance Sheet Items PP&E Schedule PP&E, Opening Balance Capital Expenditures Depreciation Expense PP&E, Ending Balance $0 $0 $0 so SO $0 $0 0 $0 $0 SO Debt Schedule Total Debt, Opening Balance Issuance (Repayment) Total Debt, Ending Balance Interest Expense $0 $0 $o SO SO $0 $0 $0 $0 SO Equity Schedule Total Equity, Opening Balance Net Income Dividends Share Issuance Buy Back) Total Equity, Ending Balance $0 $0 $0 $0 SO $0 $0 $0 $0 $0 Comparable Companies Beta Unlevered Beta Company Company A Company B Company C Company D Company E Median Levered Beta 1.45 0.92 1.26 1.03 0.88 Debt $567 $634 $321 $437 $539 Equity Debt / Equity $1,265 $914 $1,298 $1,021 $1,388 Tax Rate 36% 29% 30% 32% 31% Comparable Trading Metrics Company Name EV/Sales [x] Valuation (2021E) EV/EBITDA [x] P/E [x] Company A Company B Company C Company D Company E Median Price [$/sh.] $58.23 $71.54 $66.21 $45.68 $26.78 Market Data Market Cap Net Debt [$] [$] $168,041 ($2,719) $123,883 ($7,920) $10,326 $5,301 $11,618 $5,385 $964 $42 EV ($) $165,322 $115,963 $15,627 $17,003 $1,006 Financial Data (2021E) Sales EBITDA Earnings [$] [$] [$] $58,887 $16,523 $7,381 $56,415 $11,324 $5,618 $4,569 $1,515 $520 $5,512 $1,725 $487 $386 $97 $41 Comparable Trading Metrics Company Name Transaction Value [$] Net Debt [$] Transaction Multiples EBITDA Earnings [x] [x] Transaction 1 Transaction 2 Transaction 3 Transaction 4 Transaction 5 Median $150,000 $200,000 $80,000 $110,000 $96,000 $15,669 $35,263 $11,247 $14,884 $5,623 Financial Data EBITDA Earnings [$] [$] $17,654 $8,231 $15,345 $7,917 $6,589 $3,567 $11,256 $5,623 $9,932 $5,188 2021E 2022E 2023E 2024E 2025E 2026E 2027E 2028E 2029E 2030E Live Case Income Statement Assumptions Sales Revenue Cost of Sales SG&A Expense Depreciation Expense Other Assumptions Change in Non-Cash Working Capital Capital Expenditures Debt Issuance (Repayment) Dividends Share Issuance (Buy-Back) Scenario Inputs Base Case Income Statement Assumptions Sales Revenue Cost of Sales SG&A Expense Depreciation Expense $36.000 $21,600) ($5,400) $3,600) $38.1601 ($22,896) ($5,724) ($3,816) $40.450 ($24,270) ($6.067) $4,045) $42,877 $25,726) ($6.431) ($4,288) $45,449 (S27 270) ($6,817) ($4,545) $48.176 ($28,906) $7,226) $4,818) $51.067 ($30,640) ($) ($7,660) ($5,107) $54.131 ($32,478) ($8,120) ($5,413 $57.379 $34,427) ($8,607) ($5,738) $60,821 ($36,493) ($9,123) ($6,082) Other Assumptions Change in Non-Cash Working Capital Capital Expenditures Debt Issuance (Repayment) Dividends Share Issuance (Buy-Back) ($720) $5,000 $0 $0 $0 ($763) $5,075 $0 SO $0 ($809) $5,151 $0 $0 $0 ($858) $5,228 $0 $0 $0 ($909) $5,307 ($3,000) SO $0 ($964) $5,386 $3,000) $0 $0 ($1,021) $5,467 $0 $0 $0 ($1,083) $5,549 $0 $0 $0 ($1,148) $5,632 $0 $0 $0 ($1,216) $5.717) ($2,000) $0 $0 Low Case Income Statement Assumptions Sales Revenue Cost of Sales SG&A Expense Depreciation Expense $36.000 ($24.480) ($ 7,200) ($3.600) $36,900 ($25,092 ($7,380) ($3.690 $37,823 $25.719) $7,565) ($3.782) $38,768 ($26.362) ($7.754) ($3,877) $39.737 ($27,021) ($7.9473 ($3.974 $40,731 ($27,697) $8,146) $4,073) $41.749 ($28.389) ($8.350) ($4.175) $42,793 ($29,099) ($8.559) ($4.279) $43,863 ($29.827) $8,773) $4,386) $44.959 ($30,572) ($8,992) ($4,496) Other Assumptions Change in Non-Cash Working Capital Capital Expenditures Debt Issuance (Repayment) Dividends Share Issuance (Buy-Back) ($720) $5,000 $0 $0 $0 $738) $5.075 $0 Sol SO ($756) $5.151 $0 $01 $0 ($775) $5,228 $0 $0 $0 $795) $5.307 ($3.000) $0 $0 (S815) $5,386 $3,000) $01 $0 ($835) $5.467) $0 $0 $0 $856) $5.5491 $0 $0 $0 ($877) $5,632 $0 $0 $0 $899). $5.717 ($2,000) $0 SO High Case Income Statement Assumptions Sales Revenue Cost of Sales SG&A Expense Depreciation Expense $36.000 ($20,160) ($3,600) ($3,600] $39.4201 $22.075) ($3,942) ) ($3.942) $43,1651 ($24. 1721 ($4,316) ($4,316) $ $47,266 ($26,469) (54,727) ($4,727) $51,756 ($28,983) ($5,176) ($5,176) $56.6731 ($31.737) ($5,667) $5,667) $62,056 ($34,752) ($6,206) (S6,206) $67,9521 ($38,053) ($6.795) ($6.795) $74,407 ($41,668) ($7,441) ($7,441) $81,476 ($45,627) ($8,148) ($8,148) Other Assumptions Change in Non-Cash Working Capital Capital Expenditures Debt Issuance (Repayment) Dividends Share Issuance (Buy-Back) ($720) $5,000 $0 $0 $0 ($788) $5.075 SO $0 SO ($863) $5.151 $0 $0 $0 ($945) $5,228 $01 $0 $0 (51,035 $5,307 ($3,000) $0 SO ($1,133) $5,386 $3,000) $0 $0 ($1,241) $5,467 $0 $0 $0 ($1,359) $5.549 $0 $0 $0 $1,488) $5,632 $0 $0 $0 ($1,630) $5,7171 ($2,000) $0! $0 Download Case Study B, complete the financial model for Company XYZ, and answer the following 7 questions. 12 Review Later Under the Base Case and using precedent trading metrics and 2021E amounts, what is the implied enterprise value if the median P/E ratio is used as the basis for valuation? $86,340 $93,963 $80,171 $50,171 Download Case Study B, complete the financial model for Company XYZ, and answer the following 7 questions. 13 Review Later Under the Base Case, what is the average implied enterprise value based using: 1. NPV 2. Value implied by comparable company analysis 3. Value implied by precedent transactions If the NPV value is given a weighting of 60%, the value implied by comparable company analysis is given a weighting of 25% and the value implied by precedent transactions a weighting of 15%. For comparable company analysis and precedent transactions, use 2021E amounts and the median EV/EBITDA. For NPV, assume the terminal value is based on the perpetual growth rate assumption outlined on the "Control Panel" tab. $91,071 $91,871 $90,468 $91,268 Download Case Study B, complete the financial model for Company XYZ, and answer the following 7 questions. 14 Review Later If an investment using the value stated on the "Control Panel" tab is made at the transaction date, what is the implied IRR? Assume the High Case is used and terminal value is the average of the values determined using the perpetual growth rate and the EBITDA exit multiple assumptions outlined on the "Control Panel" tab 16.50% 16.40% 16.10% 16.20% Model Inputs and Assumptions General Assumptions Forecast Scenario Transaction Date Fiscal Year-End Days Per Year 8/1/21 12/31/21 365 Current Capitalization Cash-on-Hand PP&E Total Debt Total Equity $5,000 $60,000 $35,000 $100,000 Valuation Assumptions Tax Rate Perpetual Growth Rate EBITDA Exit Multiple 28% 2% 8.5x Risk-Free Rate Equity Risk Premium Interest Rate 3% 5% 4% Investment Amount $105,000 2021E 2022E 2023E 2024E 2025E 2026E 2027E 2028E 2029E 2030E Income Statement Sales Revenue Cost of Sales Gross Profit $0 $0 $0 $0 $0 $0 $0 $0 $0 $0 SG&A Expense Depreciation Expense Interest Expense Income Before Income Taxes Income Taxes Net Income $0 $0 $0 so SO $0 $0 $0 $0 SO $0 $0 $0 $0 $0 $0 $0 $0 $0 $0 Balance Sheet Items PP&E Schedule PP&E, Opening Balance Capital Expenditures Depreciation Expense PP&E, Ending Balance $0 $0 $0 so SO $0 $0 0 $0 $0 SO Debt Schedule Total Debt, Opening Balance Issuance (Repayment) Total Debt, Ending Balance Interest Expense $0 $0 $o SO SO $0 $0 $0 $0 SO Equity Schedule Total Equity, Opening Balance Net Income Dividends Share Issuance Buy Back) Total Equity, Ending Balance $0 $0 $0 $0 SO $0 $0 $0 $0 $0 Comparable Companies Beta Unlevered Beta Company Company A Company B Company C Company D Company E Median Levered Beta 1.45 0.92 1.26 1.03 0.88 Debt $567 $634 $321 $437 $539 Equity Debt / Equity $1,265 $914 $1,298 $1,021 $1,388 Tax Rate 36% 29% 30% 32% 31% Comparable Trading Metrics Company Name EV/Sales [x] Valuation (2021E) EV/EBITDA [x] P/E [x] Company A Company B Company C Company D Company E Median Price [$/sh.] $58.23 $71.54 $66.21 $45.68 $26.78 Market Data Market Cap Net Debt [$] [$] $168,041 ($2,719) $123,883 ($7,920) $10,326 $5,301 $11,618 $5,385 $964 $42 EV ($) $165,322 $115,963 $15,627 $17,003 $1,006 Financial Data (2021E) Sales EBITDA Earnings [$] [$] [$] $58,887 $16,523 $7,381 $56,415 $11,324 $5,618 $4,569 $1,515 $520 $5,512 $1,725 $487 $386 $97 $41 Comparable Trading Metrics Company Name Transaction Value [$] Net Debt [$] Transaction Multiples EBITDA Earnings [x] [x] Transaction 1 Transaction 2 Transaction 3 Transaction 4 Transaction 5 Median $150,000 $200,000 $80,000 $110,000 $96,000 $15,669 $35,263 $11,247 $14,884 $5,623 Financial Data EBITDA Earnings [$] [$] $17,654 $8,231 $15,345 $7,917 $6,589 $3,567 $11,256 $5,623 $9,932 $5,188 2021E 2022E 2023E 2024E 2025E 2026E 2027E 2028E 2029E 2030E Live Case Income Statement Assumptions Sales Revenue Cost of Sales SG&A Expense Depreciation Expense Other Assumptions Change in Non-Cash Working Capital Capital Expenditures Debt Issuance (Repayment) Dividends Share Issuance (Buy-Back) Scenario Inputs Base Case Income Statement Assumptions Sales Revenue Cost of Sales SG&A Expense Depreciation Expense $36.000 $21,600) ($5,400) $3,600) $38.1601 ($22,896) ($5,724) ($3,816) $40.450 ($24,270) ($6.067) $4,045) $42,877 $25,726) ($6.431) ($4,288) $45,449 (S27 270) ($6,817) ($4,545) $48.176 ($28,906) $7,226) $4,818) $51.067 ($30,640) ($) ($7,660) ($5,107) $54.131 ($32,478) ($8,120) ($5,413 $57.379 $34,427) ($8,607) ($5,738) $60,821 ($36,493) ($9,123) ($6,082) Other Assumptions Change in Non-Cash Working Capital Capital Expenditures Debt Issuance (Repayment) Dividends Share Issuance (Buy-Back) ($720) $5,000 $0 $0 $0 ($763) $5,075 $0 SO $0 ($809) $5,151 $0 $0 $0 ($858) $5,228 $0 $0 $0 ($909) $5,307 ($3,000) SO $0 ($964) $5,386 $3,000) $0 $0 ($1,021) $5,467 $0 $0 $0 ($1,083) $5,549 $0 $0 $0 ($1,148) $5,632 $0 $0 $0 ($1,216) $5.717) ($2,000) $0 $0 Low Case Income Statement Assumptions Sales Revenue Cost of Sales SG&A Expense Depreciation Expense $36.000 ($24.480) ($ 7,200) ($3.600) $36,900 ($25,092 ($7,380) ($3.690 $37,823 $25.719) $7,565) ($3.782) $38,768 ($26.362) ($7.754) ($3,877) $39.737 ($27,021) ($7.9473 ($3.974 $40,731 ($27,697) $8,146) $4,073) $41.749 ($28.389) ($8.350) ($4.175) $42,793 ($29,099) ($8.559) ($4.279) $43,863 ($29.827) $8,773) $4,386) $44.959 ($30,572) ($8,992) ($4,496) Other Assumptions Change in Non-Cash Working Capital Capital Expenditures Debt Issuance (Repayment) Dividends Share Issuance (Buy-Back) ($720) $5,000 $0 $0 $0 $738) $5.075 $0 Sol SO ($756) $5.151 $0 $01 $0 ($775) $5,228 $0 $0 $0 $795) $5.307 ($3.000) $0 $0 (S815) $5,386 $3,000) $01 $0 ($835) $5.467) $0 $0 $0 $856) $5.5491 $0 $0 $0 ($877) $5,632 $0 $0 $0 $899). $5.717 ($2,000) $0 SO High Case Income Statement Assumptions Sales Revenue Cost of Sales SG&A Expense Depreciation Expense $36.000 ($20,160) ($3,600) ($3,600] $39.4201 $22.075) ($3,942) ) ($3.942) $43,1651 ($24. 1721 ($4,316) ($4,316) $ $47,266 ($26,469) (54,727) ($4,727) $51,756 ($28,983) ($5,176) ($5,176) $56.6731 ($31.737) ($5,667) $5,667) $62,056 ($34,752) ($6,206) (S6,206) $67,9521 ($38,053) ($6.795) ($6.795) $74,407 ($41,668) ($7,441) ($7,441) $81,476 ($45,627) ($8,148) ($8,148) Other Assumptions Change in Non-Cash Working Capital Capital Expenditures Debt Issuance (Repayment) Dividends Share Issuance (Buy-Back) ($720) $5,000 $0 $0 $0 ($788) $5.075 SO $0 SO ($863) $5.151 $0 $0 $0 ($945) $5,228 $01 $0 $0 (51,035 $5,307 ($3,000) $0 SO ($1,133) $5,386 $3,000) $0 $0 ($1,241) $5,467 $0 $0 $0 ($1,359) $5.549 $0 $0 $0 $1,488) $5,632 $0 $0 $0 ($1,630) $5,7171 ($2,000) $0! $0
Step by Step Solution
There are 3 Steps involved in it

Get step-by-step solutions from verified subject matter experts