

Question: The information about Microsoft, given earlier in this chapter, is quite old. You have just found a good position in the finance department at Microsoft,
The information about Microsoft, given earlier in this chapter, is quite old. You have just found a good position in the finance department at Microsoft, at their headquarters office in Redmond, WA. Your first assignment is to find the current values of the financial ratios. You should focus on the ratios related to the short-term financial management of the company. Do you find any significant changes in these values, compared to the numbers for 2001? Comment on the significance of these changes. Please show your source as you will have to find present values
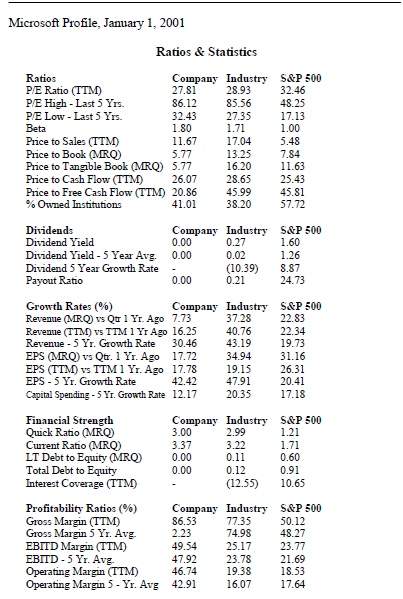
Microsoft Profile, January 1, 2001 Ratios & Statistics Ratios PE Ratio (TTM P/E High -Last 5 Yrs. P/E Low - Last 5 Yrs. 2 Company Industry S&P 500 27.81 86.12 28.93 85.56 32.43 27.351713 32.46 48.25 1.80 Price to Sales (TTM) Price to Book MRQ Price to Tangible Book MRQ) 5.77 Price to Cash Flow (TTM 26.07 28.65 25.43 Price to Free Cash Flow (TTM 20.86 45.99 45.81 % Owned Institutions 1.6717.045418 5.77 13.25 784 16.20 11.63 38.20 57.72 Dividends Dividend Yield Company Industry S&P 500 0.00 0.27 Dividend Yield-5 Year Avg 0.00 Dividend 5 Year Growth Rate . Payout Ratio (10.39 8.87 0.21 0.00 24.73 Growth Rates (%) Revenue (MRQ vs Qur1 Yr. Ago 7.73 Revenue (TTM) vs TTM1 Yr Ago 16.25 Revenue -5 Yr. Growth Rate 30.46 EPS MRQ vs Qt. 1 Yr. Ago 17.72 34.94 31.16 EPS (TTM vs TTM1Yr. Ago 17.7819.15 26.31 EPS -5Yr. Growth Rate Capital Spending-5 Yr. Growth Rate 12.17 Company Industry S&P 500 37.28 40.76 43.19 19.73 42.42 20.41 17.18 20.35 Financial Strength Quick Ratio MRO Current Ratio(MRQ) LT Debt to Equity MRQ) Total Debt to Equity Interest Coverage (TTM) Company Industry S&P 500 3.00 2.99 3.22 1.21 0.60 0.91 (12.55 10.65 0.00 0.00 Profitability Ratios (%) Gross Margin (TTM) Gross Margin 5 Yr. Avg. EBITD Margin (TTM) EBITD 5 Yr. Avg Operating Margin (TTM)46 Operating Margin 5 - Yr. Avg 42.91 Company Industry S&P 500 86.53 50.12 48.27 49.5425.17 23.77 7.92 23.78 21.69 18.53 16.07 17.64 77.35 74.98 46.74 19.38 5
Step by Step Solution
There are 3 Steps involved in it

Get step-by-step solutions from verified subject matter experts