

Question: The information shown in Exhibit 1 . 6 is typical of reporting required of publicly traded companies. These reports are filed both quarterly and annually
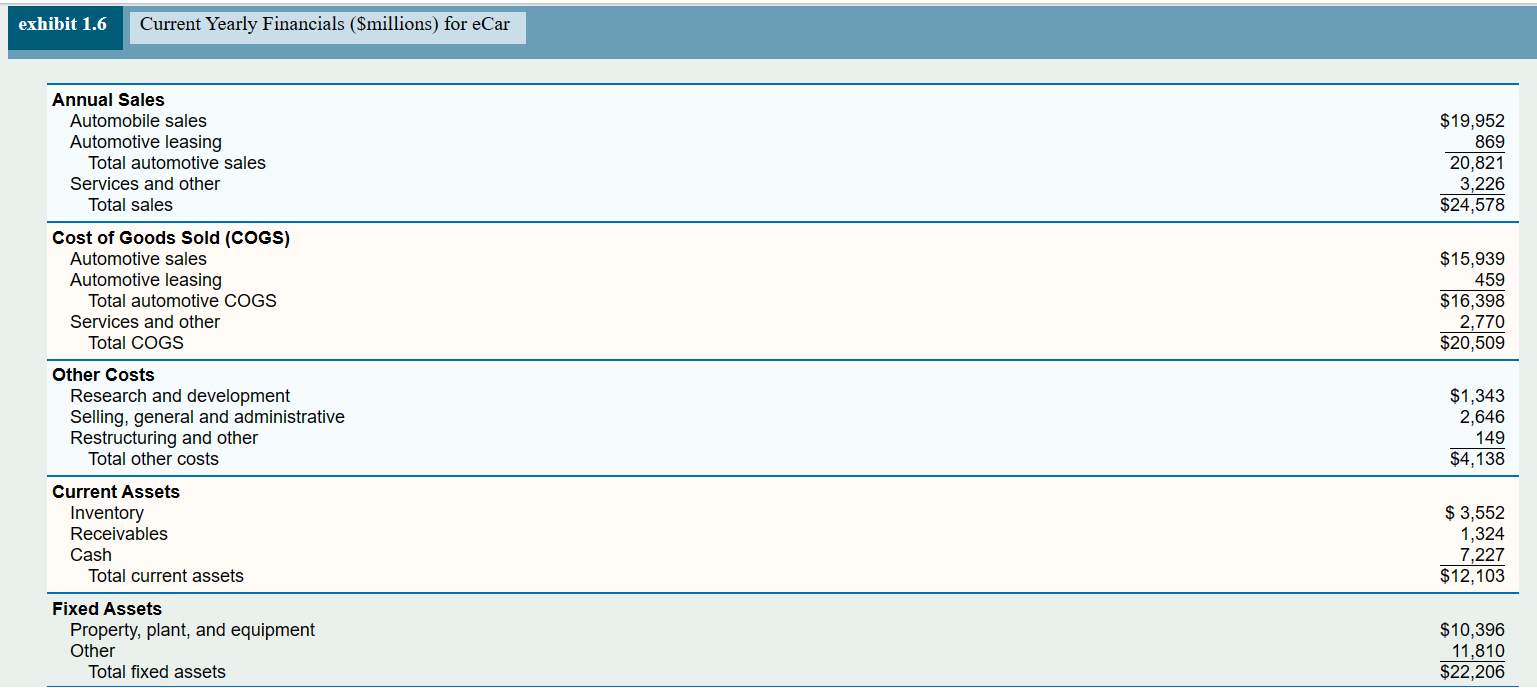
The information shown in Exhibit is typical of reporting required of publicly traded companies. These reports are filed both quarterly and annually and are closely followed by analysts. The reports are accompanied by extensive notes that explain the information shown in the reports. Companies are not required to report some of the details that might be of interest to an OSCM professional, such as direct material and labor expense. These details are summarized in the COGS entries. Of course, if you work for the company, the details will probably be available for your analysis.
In the following steps, you will be asked to analyze the impact of proposed projects relative to profit margin, asset turnover, and return on investment.
Set up the spreadsheet with the SCIM equations. To get started, setup a spreadsheet with the data in Exhibit In your spreadsheet, make sure to calculate the totals that are given in the exhibit. For example, Total automotive sales is the sum of Automotive sales and Automotive leasing. Further, Total sales is the sum of Total automotive sales, and Services and other. The idea is to make the spreadsheet capture potential changes in the detail accounts. So if Automotive sales changes, the Total automotive sales and Total sales number automatically change to reflect the update.
aUsing the data in Exhibit and your spreadsheet, calculate the profit margin, asset turnover, page and return on assets of the company as presented in Exhibit Hint: Profit margin and return on assets are negative.
Step by Step Solution
There are 3 Steps involved in it
1 Expert Approved Answer
Step: 1 Unlock

Question Has Been Solved by an Expert!
Get step-by-step solutions from verified subject matter experts
Step: 2 Unlock
Step: 3 Unlock