Question: The information you need for this question is foundin the Physician Care Services, Inc. (PCS) financial statementsin Middleboro, pp. 102-103, Table 3.7 and Table 3.8.
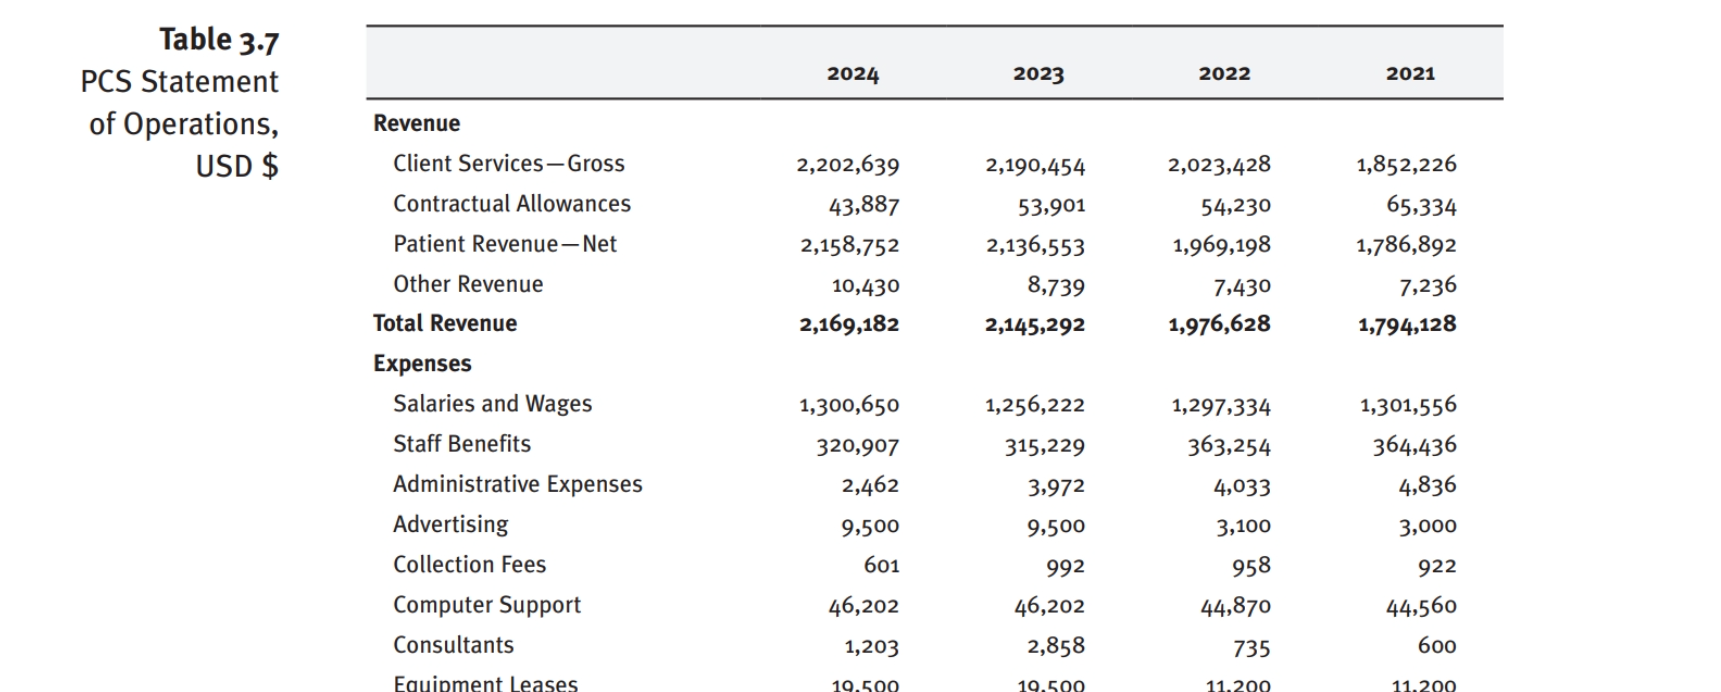
The information you need for this question is foundin the Physician Care Services, Inc. (PCS) financial statementsinMiddleboro, pp. 102-103, Table 3.7 and Table 3.8. Table 3.7 presents a standard Income (revenue) and expense statement. This document describes PCS's financial activity over a fiscal year, which in this case we can assume is the same as the calendar year, though that is not always the case. Table 3.6 provides some of the figures needed to calculate the ratios you have been asked to calculate. Table 3.7 is PCS's balance sheet. This is a snapshot of its financial status at a single point in time at the close of business on December 31 for each of the years shown at the top of the table. Some of the figures needed to calculate the ratios will come from this table.
Calculate the following ratios for each of the three years: 2022, 2023, and 2024.
Current Ratio
Debt to Equity Ratio
Operating Margin
Return on Assets
Net Margin
Days in Accounts Receivable
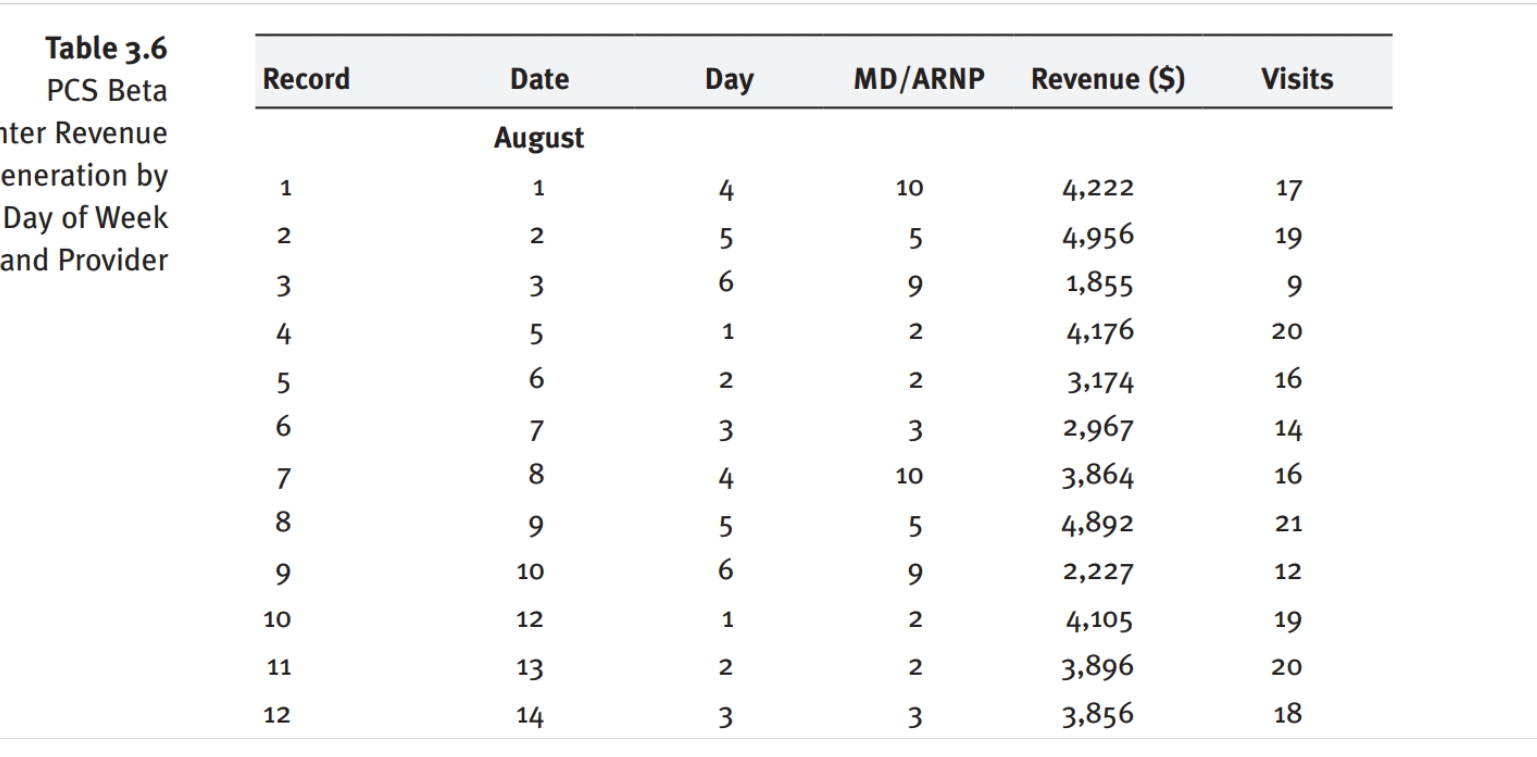
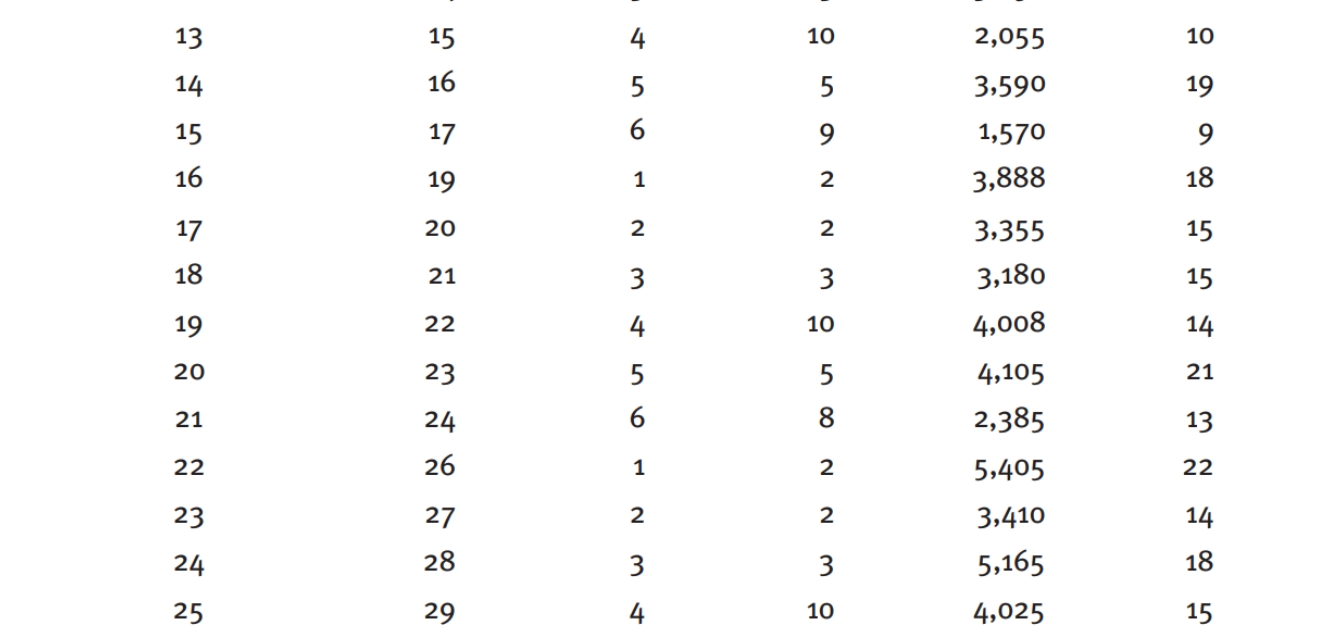
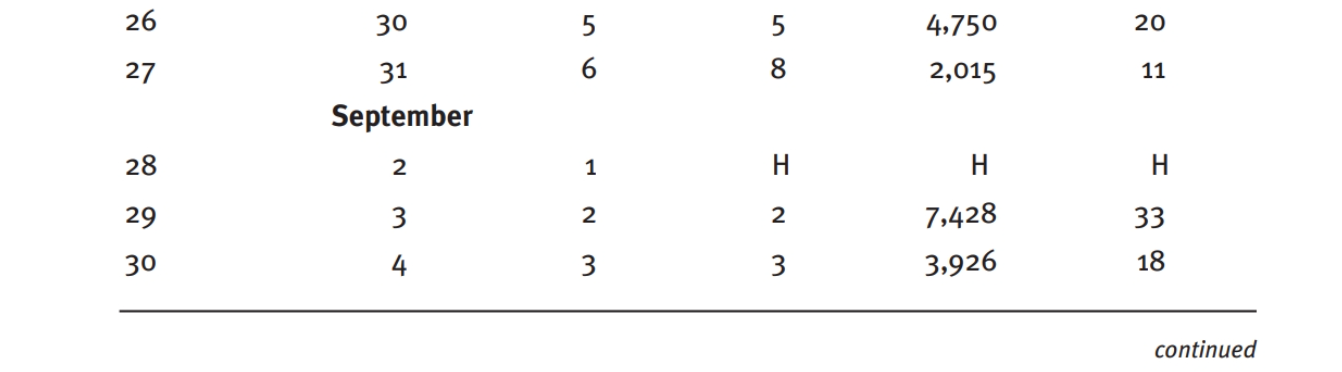
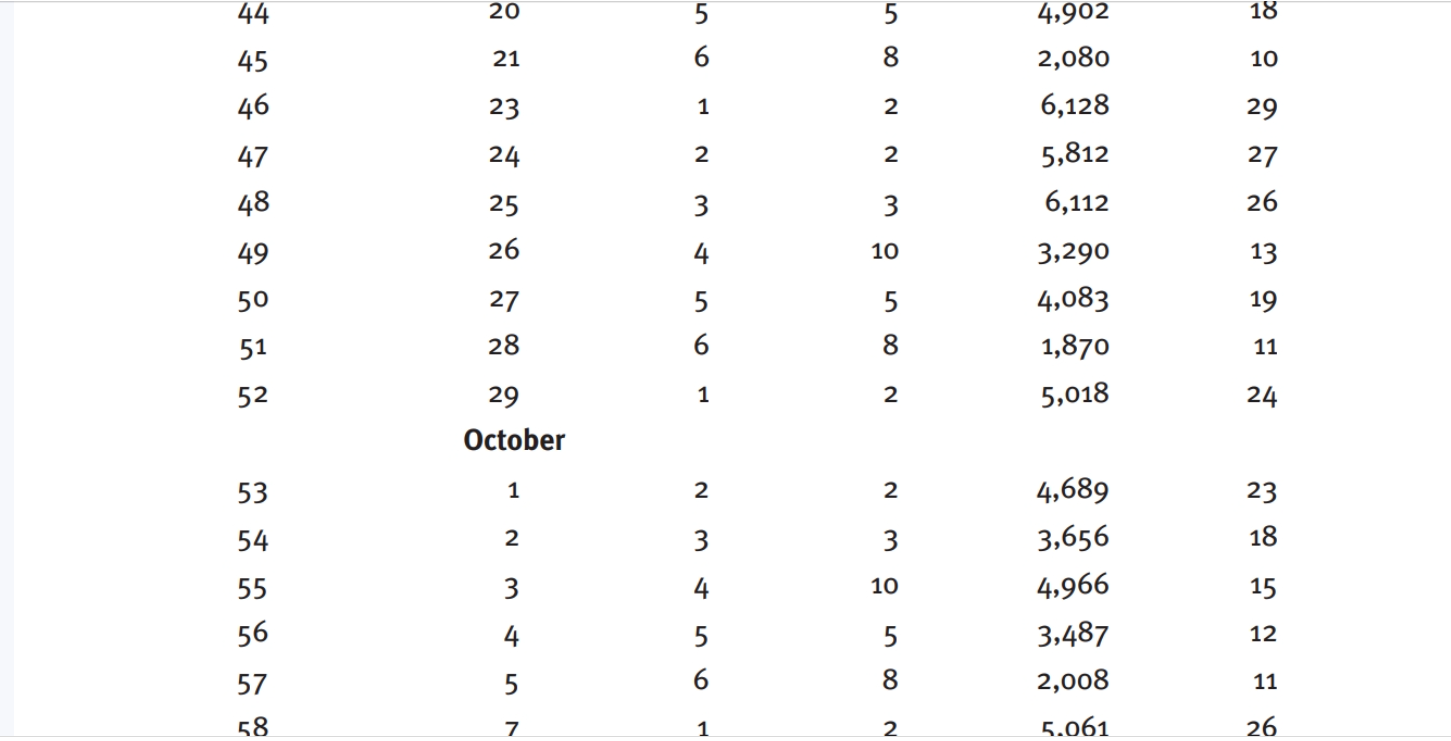
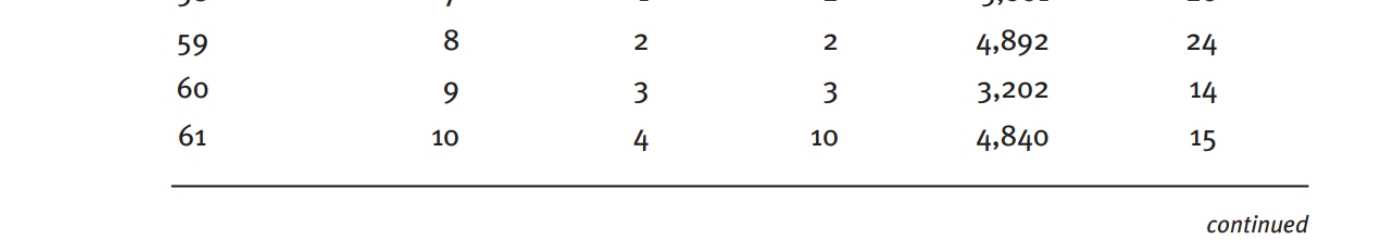
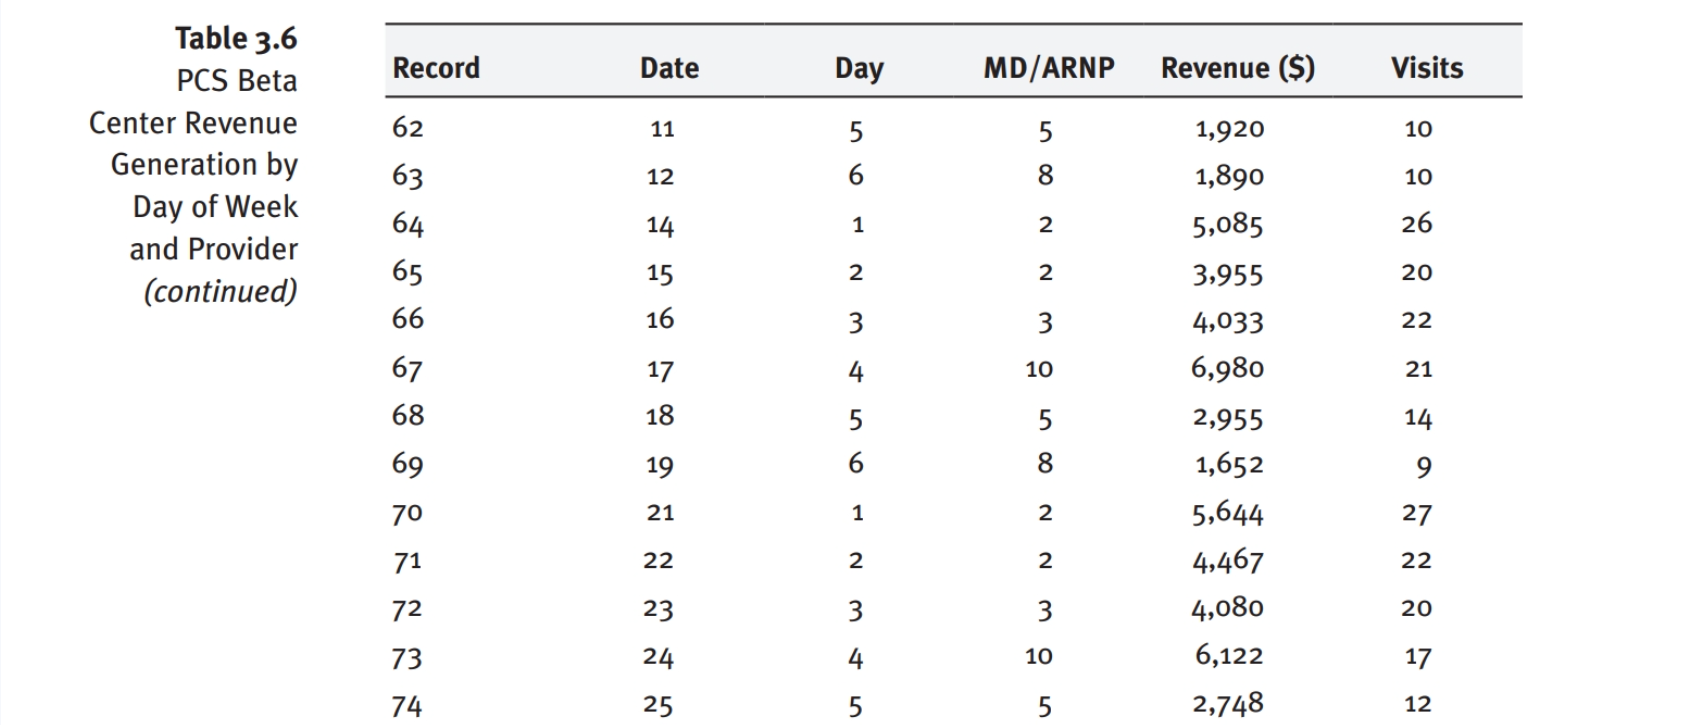
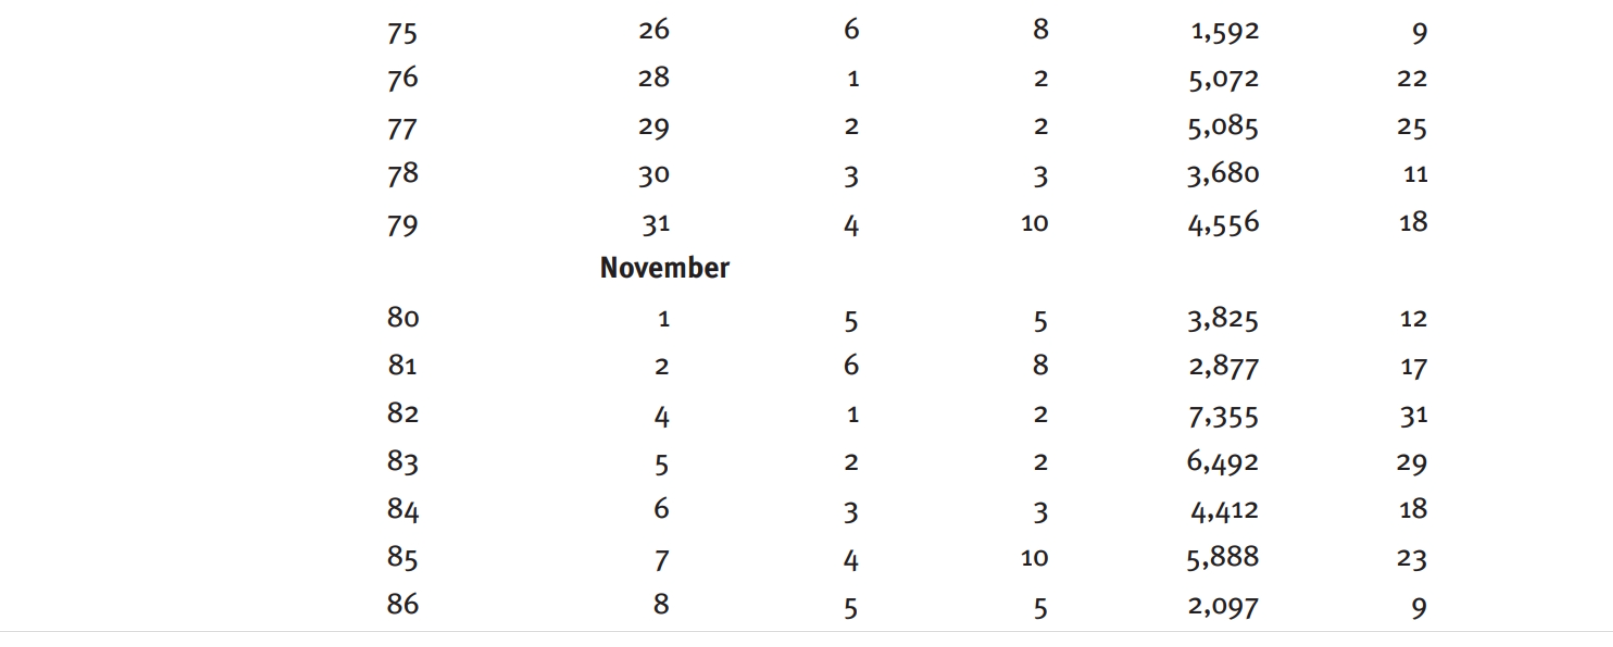
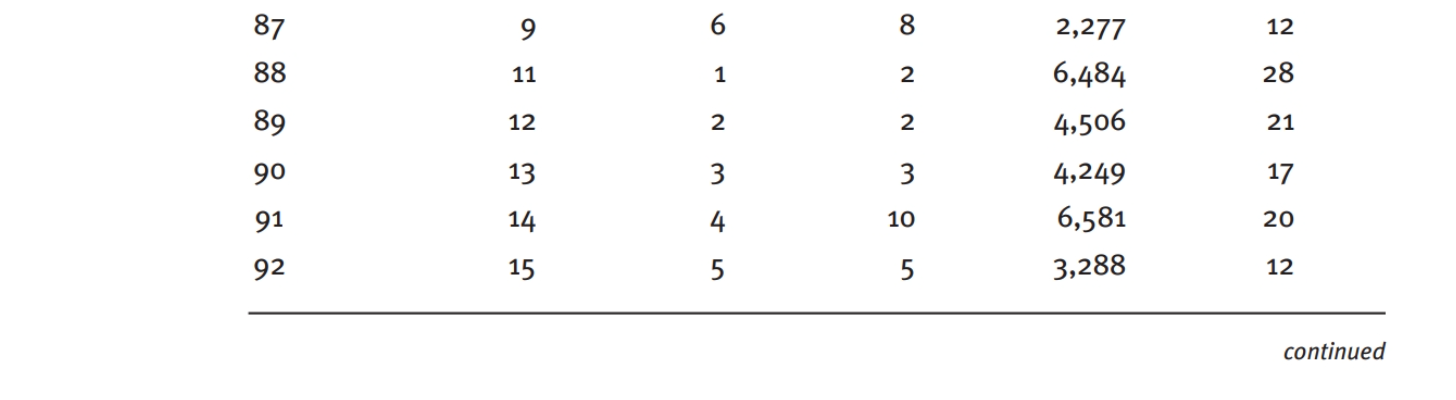
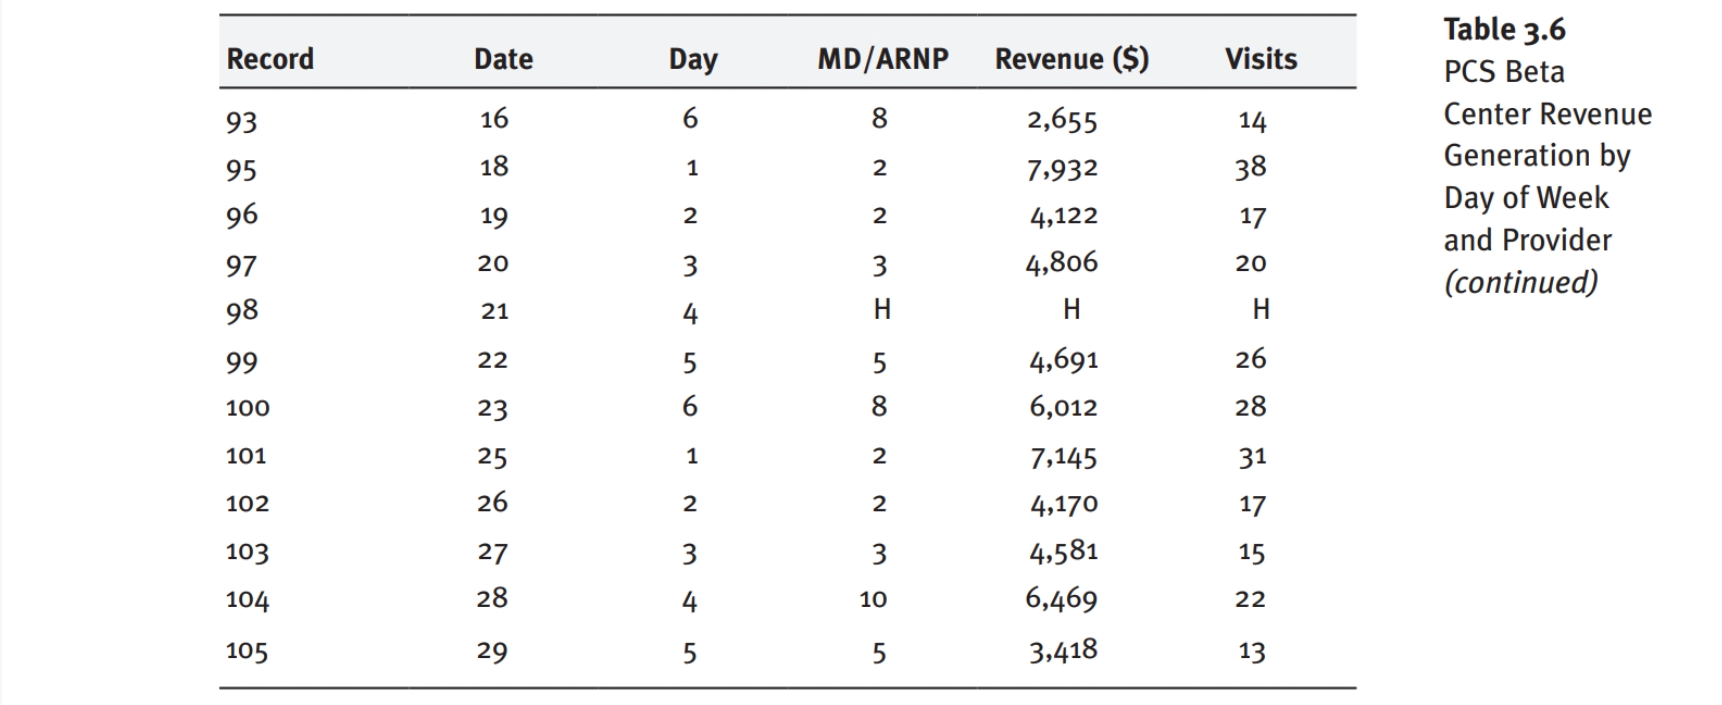
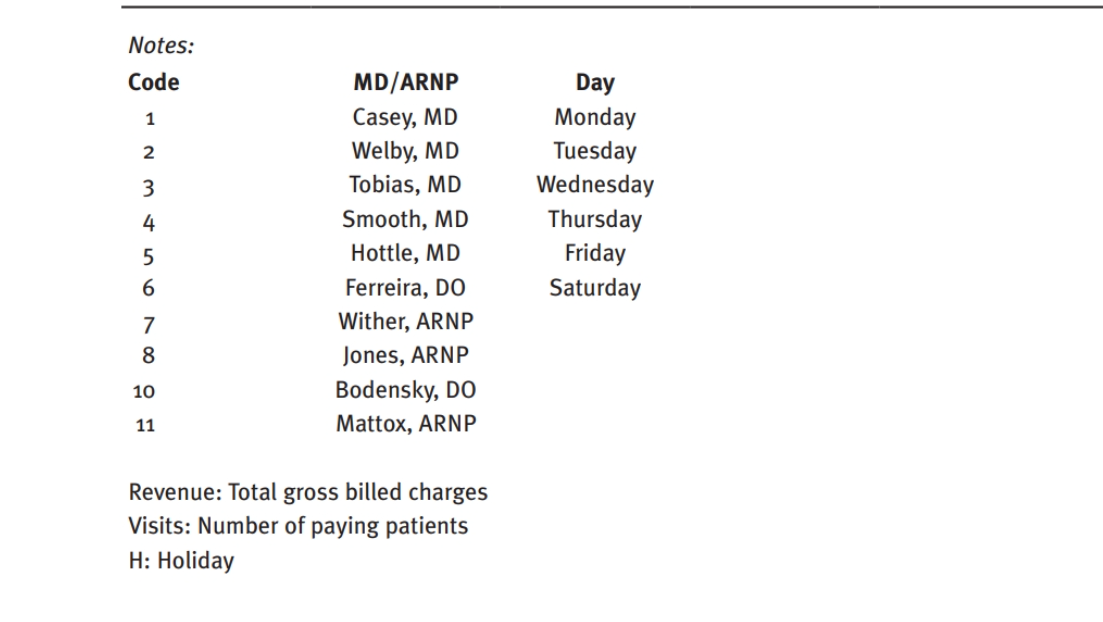
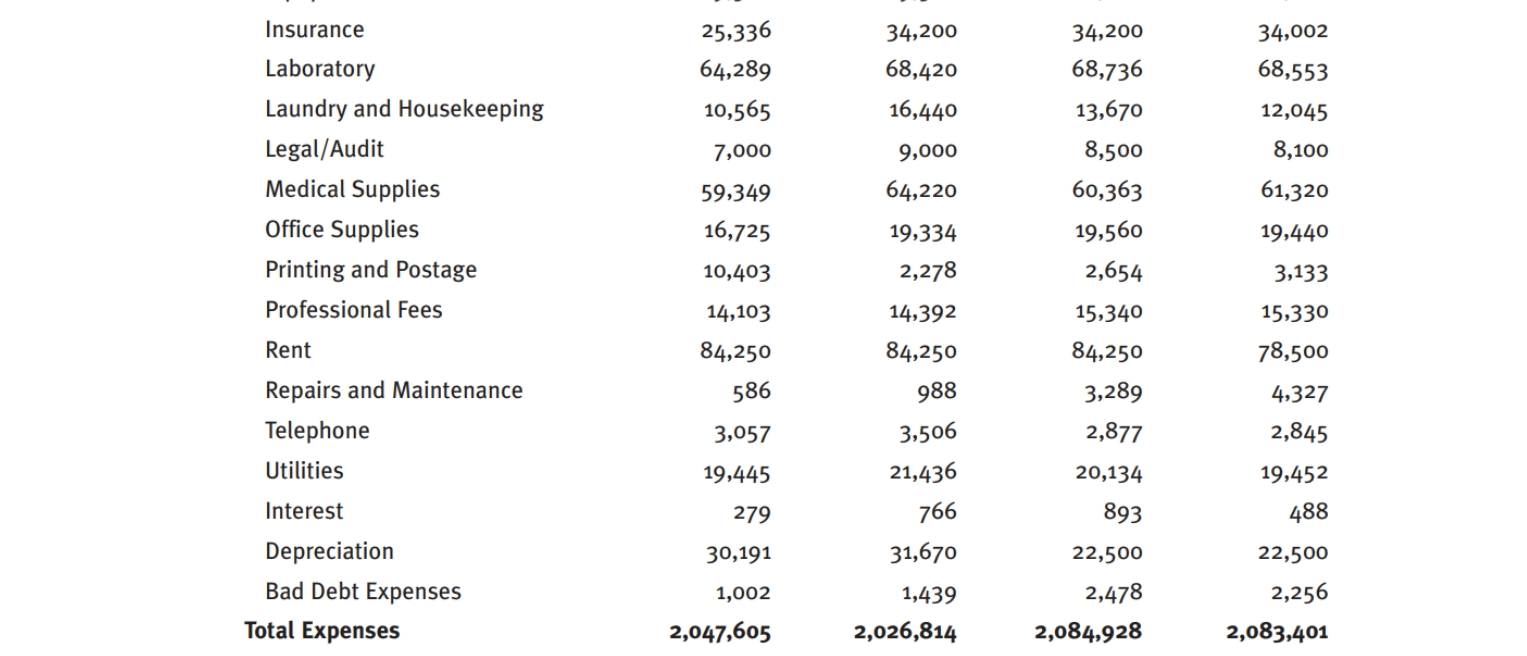
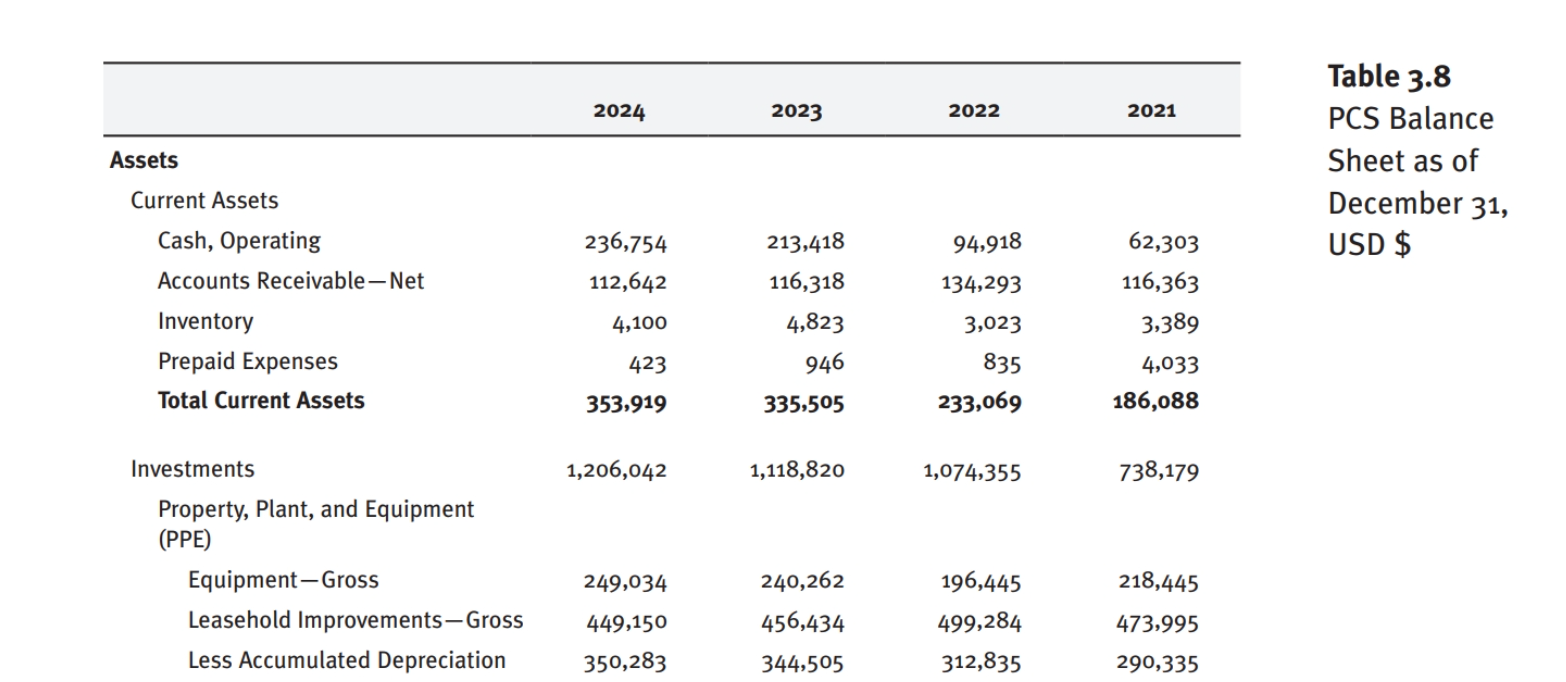
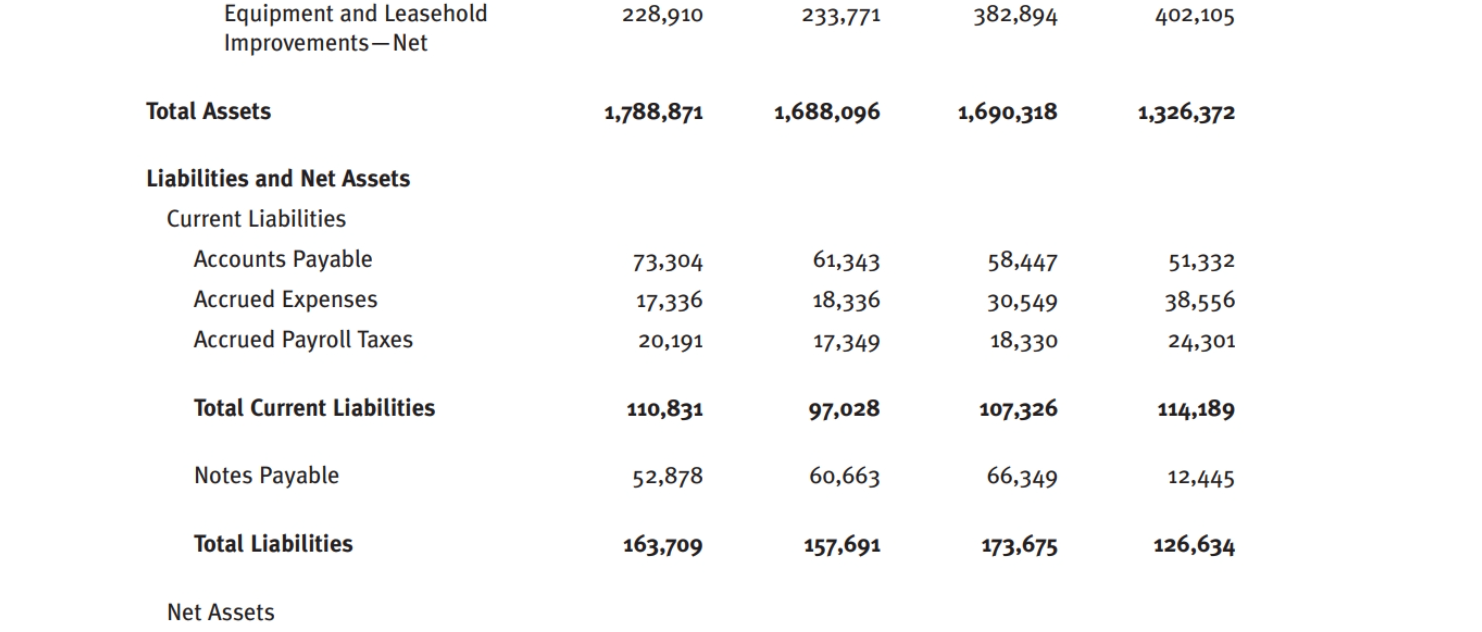
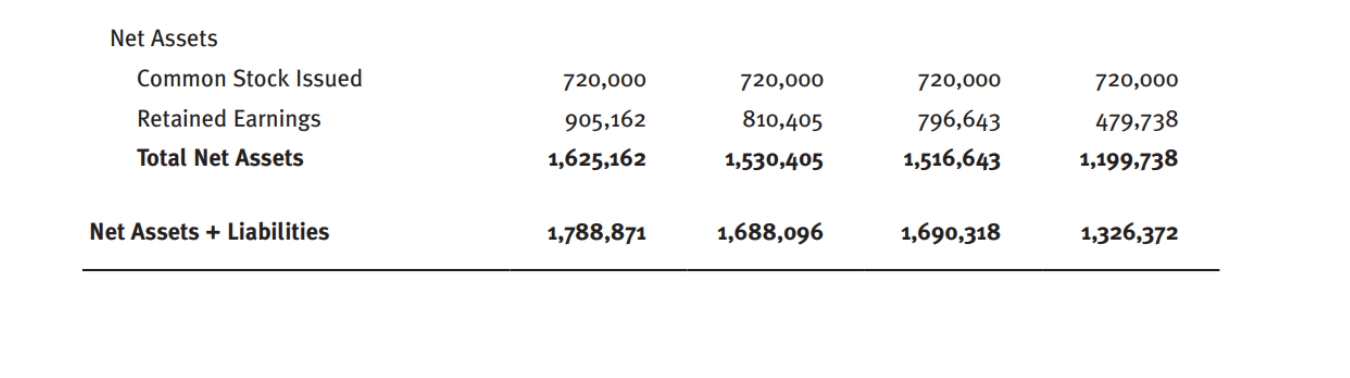
Table 3.6 PCS Beta Record Date Day MD/ARNP Revenue ($) Visits ter Revenue August eneration by 1 10 4,222 17 Day of Week 4,956 19 and Provider 1,855 9 4,176 20 DO V A V W N H 3,174 16 60 Va UA W N 2,967 14 WNHOUAWN Ha VIA WNNOVOW N N OUT 3,864 16 4,892 21 10 2,227 12 4,105 19 11 13 3,896 20 12 14 3,856 18\f26 30 27 a UT 4,750 20 00 UT 31 2,015 September 11 28 2 H 29 H WNA W NI 30 7,428 33 4 3,926 18 continuedTable 3.6 Record Date Day MD/ARNP Revenue ($) Visits PCS Beta 31 10 5,922 17 Center Revenue 32 4,099 13 Generation by Day of Week 33 1,162 6 and Provider 34 8,270 42 (continued) 35 10 3,464 17 36 11 3,467 15 37 12 AWNHOUAWNHAVA WNNOOUT OWN N OOUT 5,265 16 38 13 5,389 18 39 14 2,004 9 40 16 6,430 33 41 17 5,289 26 42 18 4,377 22 43 19 10 5,278 12\f59 4,892 24 1 00 60 W N - W N 3,202 14 61 10 10 4,840 15 continuedTable 3.6 Record Date Day MD/ARNP Revenue ($) Visits PCS Beta Center Revenue 62 11 1,920 10 Generation by 63 12 1,890 10 Day of Week 64 14 5,085 26 and Provider 65 15 3,955 20 (continued) 66 16 4,033 22 67 17 6,980 21 WNNOOVOW N N OOUT 68 18 UI AWNNAUA W NHOUT 2,955 14 69 19 1,652 9 70 21 5,644 27 71 22 4,467 22 72 23 4,080 20 73 24 10 6,122 17 74 25 UT 2,748 12\f87 9 2,277 12 88 11 6,484 28 89 12 W N N OO 4,506 21 90 13 4,249 17 91 F 10 6,581 20 92 15 5 3,288 12 continuedTable 3.6 Record Date Day MD/ARNP Revenue ($) Visits PCS Beta 93 16 6 2,655 14 Center Revenue 95 18 7,932 38 Generation by 96 19 4,122 17 Day of Week 97 20 4,806 and Provider 20 98 (continued) 21 H H 99 WN N OU I W N N OO 22 4,691 26 100 23 UAWNHAU AW NA 6,012 28 101 25 7,145 31 102 26 4,170 17 103 27 4,581 15 104 28 10 6,469 22 105 29 5 3,418 13Notes: Code MD/ARNP Day Casey, MD Monday Welby, MD Tuesday Tobias, MD Wednesday Smooth, MD Thursday Hottle, MD Friday OOO Va VIA W N H Ferreira, DO Saturday Wither, ARNP Jones, ARNP Bodensky, DO 11 Mattox, ARNP Revenue: Total gross billed charges Visits: Number of paying patients H: HolidayTable 3.7 PCS Statement 2024 2023 2022 2021 of Operations, Revenue USD $ Client Services-Gross 2,202,639 2,190,454 2,023,428 1,852,226 Contractual Allowances 43,887 53,901 54,230 65,334 Patient Revenue-Net 2,158,752 2,136,553 1,969,198 1,786,892 Other Revenue 10,430 8,739 7,430 7,236 Total Revenue 2,169,182 2,145,292 1,976,628 1,794,128 Expenses Salaries and Wages 1,300,650 1,256,222 1,297,334 1,301,556 Staff Benefits 320,907 315,229 363,254 364,436 Administrative Expenses 2,462 3,972 4,033 4,836 Advertising 9,500 9,500 3,100 3,000 Collection Fees 601 992 958 922 Computer Support 46,202 46,202 44,870 44,560 Consultants 1,203 2,858 735 600 Equipment Leases 10.500 10. 1.200 11.2Insurance 25,336 34,200 34,200 34,002 Laboratory 64,289 68,420 68,736 68,553 Laundry and Housekeeping 10,565 16,440 13,670 12,045 Legal/Audit 7,000 9,000 8,500 8,100 Medical Supplies 59,349 64,220 60,363 61,320 Office Supplies 16,725 19,334 19,560 19,440 Printing and Postage 10,403 2,278 2,654 3,133 Professional Fees 14,103 14,392 15,340 15,330 Rent 84,250 84,250 84,250 78,500 Repairs and Maintenance 586 988 3,289 4,327 Telephone 3,057 3,506 2,877 2,845 Utilities 19,445 21,436 20,134 19,452 Interest 279 766 893 488 Depreciation 30,191 31,670 22,500 22,500 Bad Debt Expenses 1,002 1,439 2,478 2,256 Total Expenses 2,047,605 2,026,814 2,084,928 2,083,401Income (Loss) Before Taxes 121,577 118,478 108,300 289,273 Federal Tax 31,610 30,804 0 0 State Tax 948 924 o 0 Income (Loss) After Taxes 89,019 86,750 -108,300 289,273 Assets Current Assets Cash, Operating Accounts Receivable Net Inventory Prepaid Expenses Total Current Assets Investments Property, Plant, and Equipment (PPE) EquipmentGross Leasehold ImprovementsGross Less Accumulated Depreciation 2024 236-754 112,642 4.100 423 353-919 1,206,042 249,034 449.150 350.283 2023 213,418 116,318 4.323 945 335-505 1,118,820 240,262 456.434 344.505 2022 94.918 134.293 3.023 835 233.069 1.074355 196.445 499.234 312.835 2021 62.303 116,363 3389 4.033 186.088 738.179 218,445 473.995 290.335 Table 3.8 PCS Balance Sheet as of December 31, USD $ Equipment and Leasehold ImprovementsNet Total Assets Liabilities and Net Assets Current Liabilities Accounts Payable Accrued Expenses Accrued Payroll Taxes Total Current Liabilities Notes Payable Total Liabilities Net ASSEtS 228.910 1,788,871 73,304 17.336 20.191 110.831 52.378 163.709 233-771 1.688.096 61.343 18,336 17349 97,028 60,663 151.691 382,394 1,690,318 58.447 30.549 18,330 107.326 66.349 173.675 402,105 1.326371 51.332 38.556 24.301 114,189 12.445 126,634 Net Assets Common Stock Issued 720,000 Retained Earnings 905,162 Total Net Assets 1,625,162 Net Assets + Liabilities 1,788,871 720,000 810.405 1.530.405 1,688,096 720.000 796.643 1.516.643 1,690,318 720,000 479.738 1.199.738 1.326.372
Step by Step Solution
There are 3 Steps involved in it
1 Expert Approved Answer
Step: 1 Unlock
Question Has Been Solved by an Expert!
Get step-by-step solutions from verified subject matter experts
Step: 2 Unlock
Step: 3 Unlock
Students Have Also Explored These Related Accounting Questions!